Figures & data
Figure 1. In vitro characteristics of ReN human neural progenitor-derived cultures. (a) and (b) ReN neural progenitor cells differentiate into cultures with neuronal morphology over 21 DIV. (c) ReN cells can also be differentiated as thin 3D cultures embedded within Matrigel matrix. (d) Representative Z-stacked projection of ReN neural progenitor cells stained with Nestin (NES; green) before differentiation. (e) Representative Z-stacked projection of neurons and astrocytes in thin-3D ReN cells at day 28 post-standard differentiation. Neurons were stained with beta-III-tubulin (TUBB3; red), astrocytes were stained with glial fibrillary acidic protein (GFAP; green) and nuclei were counterstained using DAPI (Blue). Immunofluorescence images were acquired using the 63X oil immersion objective of a Zeiss LSM 700 instrument (scale bar = 10 µm). (f) ReN cells express markers of neurons (TUBB3) and astrocytes (GFAP), neural progenitors (NES) and PrPC throughout standard differentiation. NeuN expression was also detected in ReN lysate at day 0 StdD.
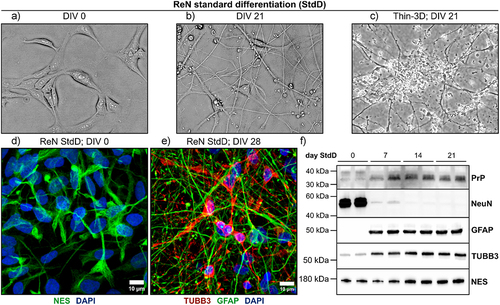
Figure 2. Enrichment of GFP expressing transduced ReN cells using puromycin antibiotic selection. (a) Kill curve with puromycin antibiotic on non-treated ReN cells revealed a concentration of 0.5 µg/mL was sufficient to kill all cells after 48 hours. (b) Lentiviral-transduced ReN cells can be selected with puromycin antibiotic treatment. ReN cells were treated with 1 μL of mouse PrPC expressing lentiviral prep (LV-prep) for 72 hours, with or without TransDux enhancer, at which point the cells were treated with 0.5 μg/mL puromycin. Images were taken with a phase contrast microscope 3 days following puromycin treatment. (c) GFP expression in ReN cells before and after lentiviral transduction. Cells were fixed and stained with DAPI before imaging for GFP via fluorescence microscopy. Images were acquired using the 40X oil objective of a Zeiss LSM 700 instrument (scale bar = 50 µm).
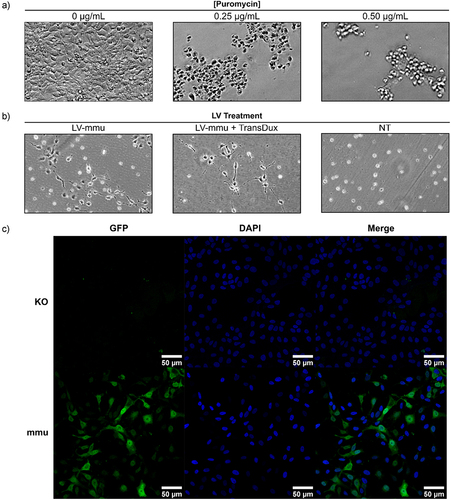
Figure 3. Lentiviral-transduced ReN cell lines overexpress PrPC and differentiate into neurons and astrocytes. (a) Lentiviral-transduced ReN cell lines were produced that overexpress the mouse, hamster and human 129M and 129V versions of PrPC. Lysate from proliferating ReN progenitor cell lines was western blotted for PrPC using the 6H4 (recognizes mouse and human PrP) and 3F4 (recognizes hamster and human PrP) monoclonal antibodies. Total protein signal was measured in Bio-Rad TGX stain-free gels according to manufacturer’s instructions. (b) the 129M and WT ReN cell lines exhibit a similar pattern of protein expression for PrP, TUBB3 and GFAP throughout the process of differentiation into neurons and astrocytes. ReN cells were differentiated as thin-3D cultures and lysate collected at weekly timepoints post-differentiation was western blotted for PrP (via 3F4 mAb), TUBB3 and GFAP. Signal was normalized to the most prominent band in the corresponding total protein image (see arrow). (c) Normalized protein expression of PrP, TUBB3 and GFAP in ReN WT and 129M cells throughout standard differentiation. Signal intensity was quantified using imageJ and normalized to the signal from the strongest band identified in total protein images. (d) qPCR-based quantification of GFAP, TUBB3 and PRNP of ReN 129M, WT and Empty cells over 4 weeks of differentiation. PRNP was quantified using PCR primers that bind the non-coding mRNA region (PRNP) and protein-coding region of the mRNA (PRNP_CDS). * p-value<0.05 (calculated using one-way ANOVAs).
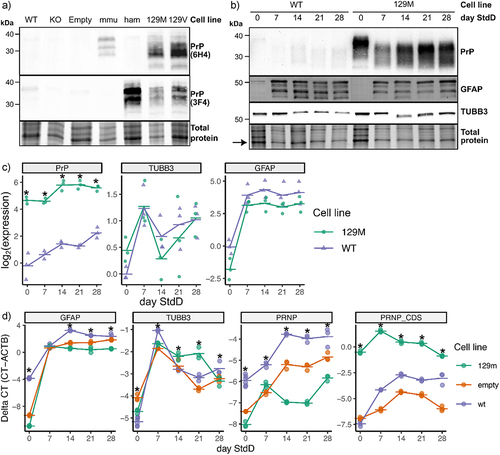
Table 1. Summary of ReN cell lines. WT – wild type; KO – PRNP knocked out; NPC – neural progenitor cell; PuroR – puromycin resistance; GFP – green fluorescence protein.
Figure 4. PrPC is localized to TUBB3 expressing neurons in ReN 129M cells. Immunofluorescence was used to image ReN WT, KO and 129M cells by staining for TUBB3 (yellow), GFAP (green) and PrP (Red). Nuclei were counterstained with DAPI (Blue). Representative images are shown at days 7 and 21 post-differentiation. Images were acquired using the 63X oil immersion objective of a Zeiss LSM 700 instrument (scale bar = 10 µm).
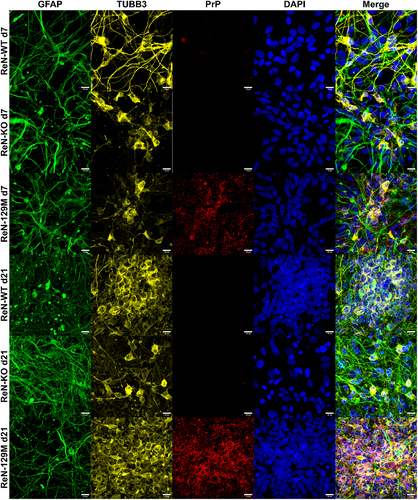
Figure 5. Altered arrangement into spheroid-like structures by ReN cells that express different levels of PrPC. (a) Representative Z-stack projections of 5x5 tile images taken with a 20x objective of ReN 129M, WT and KO cells after staining for TUBB3, GFAP and PrP at day 21 post-differentiation (scale bar = 200 µm). Area and fluorescence intensity within individual spheroids were analyzed with imagej. Fluorescence of GFAP, PrP and TUBB3 was normalized to the fluorescence of DAPI. (b) Area per spheroid. (c) Number of spheroids per image. (d) Mean normalized fluorescence intensity per spheroid. * p-value < 0.05, ** p-value < 0.01, *** p-value < 0.001. p-values were calculated using one-way ANOVAs.
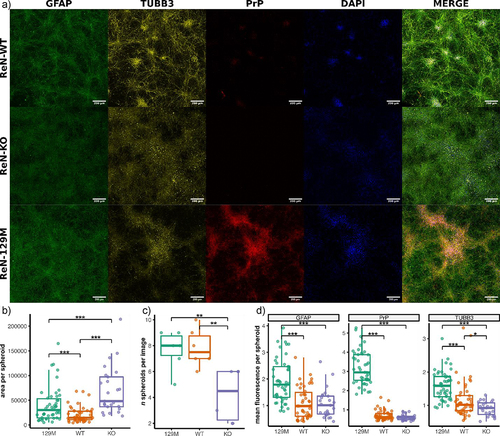
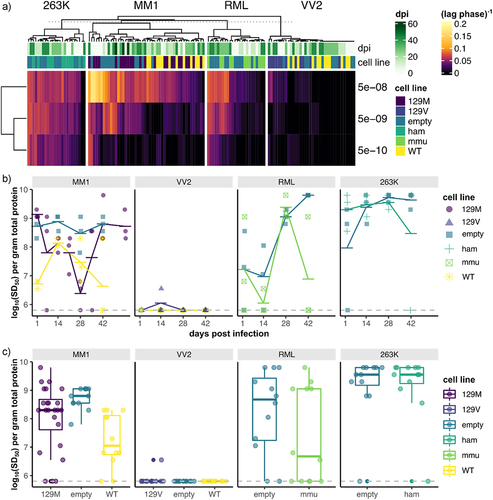
Figure 6. Prion seeding activity is consistently detected within ReN cultures for 6 weeks following inoculation with four prion isolates. To examine prion replication in differentiated ReN cultures, ReN-PrP−/−, ReN-PrP+/+ and ReN-PrP++/++ cells were differentiated for one week, then inoculated with one of four prion isolates. Prion inocula included human clinical isolates of Scjd-MM1 and Scjd-VV2, the RML strain of mouse-adapted scrapie, and the 263K strain of hamster-adapted scrapie. ReN cultures were maintained for 6-week post-inoculation with lysate collections in triplicate every 2 weeks. (a) Schematic representation of the experimental workflow. PrPSc amyloid seeding activity in ReN cell lysates was measured via RT-QuIC at each time point post-inoculation with the four prion isolates. (b) ThT fluorescence signal is plotted against reaction time for RT-QuIC assays seeded with 5e-08, 5e-09 and 5e-10 g total protein of ReN cell lysate.
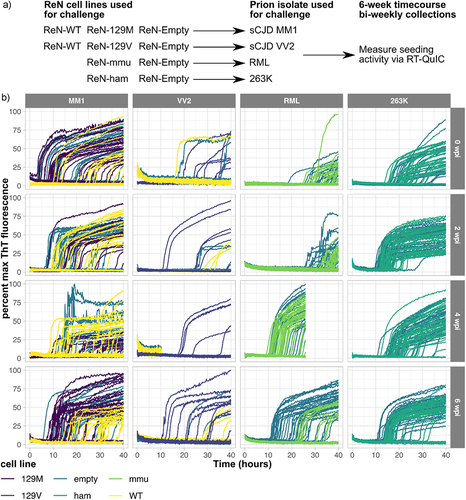
Figure 7. Prion seeding activity within ReN cultures does not surpass residual inoculum throughout 6-weeks post challenge with four prion isolates. PrPSc-seeding activity was quantified via lag-phase−1 measurements from each individual RT-QuIC reaction. The mean lag-phase−1 value for each dilution (5e-8, 5e-9 and 5e-10 g total protein of lysate) per sample was then visualized as a hierarchical-clustered heatmap (a). RT-QuIC lag-phase−1 measurements did not cluster based on timepoint post-inoculation, suggesting that prion-seeding activity did not change over time in any of the conditions tested. We applied the spearman-karber transformation to the RT-QuIC data to obtain a single quantitative measurement of prion-seeding activity within each sample, expressed as log10(SD50) per gram of total protein. To assess prion replication, RT-QuIC log10(SD50) was plotted against days post infection (b), and to compare overall seeding activity per condition, RT-QuIC log10(SD50) was plotted per each cell line and inoculum (c). Prion seeding activity in ReN-PrP+/+ and ReN-PrP++/++ cells never surpassed ReN-PrP−/− cells, which were included to account for signal from residual inoculum.