Figures & data
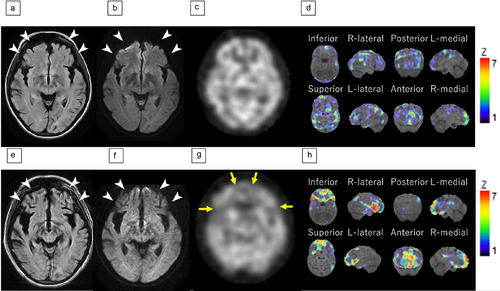
Figure 1. Brain MRI and SPECT.
(a–d) MRI and 123I-IMP SPECT at 11 months post-onset.
(a) FLAIR MRI sequence shows bilateral frontal lobe-dominant cerebral atrophy (arrow heads). (b) No signal hyperintensity change detected on DWI MRI sequence. 123I-IMP SPECT (c) and 3D-SSP hypoperfusion maps (d) reveal non-specific mild hypoperfusion, probably associated with cerebral atrophy.
(e–h) MRI and 123I-IMP SPECT at 52 months post-onset.
(e) FLAIR shows apparent cerebral atrophy, especially in the bilateral frontal lobe (arrow heads). (f) No signal hyperintensity change detected on DWI. 123I-IMP SPECT (g) and 3D-SSP hypoperfusion maps (h) reveal marked decreased regional CBF, predominantly in the bilateral right-dominant frontal lobe (yellow arrows).
Colors indicate degree of CBF perfusion: red, severely decreased; yellow, moderately decreased; green and blue, mildly decreased. Areas with low blood flow are indicated. Areas with Z-scores >2 had a statistically significant reduction in blood flow. MRI, magnetic resonance imaging; SPECT, single-photon emission computed tomography; FLAIR, fluid-attenuated inversion recovery; SSP, stereotactic surface projections; IMP, iodoamphetamine; CBF, cerebral blood flow.