Figures & data
Figure 1. Graphic presentation of the sequencing analysis of PRNP. DNA sequences from the two patients at codon 97, codon 129 and codon 219. Heterozygous transition at codon 97 from ser (S) to asp (N) in one PRNP allele (left graph), homozygous methionine (M) at codon 129 (middle graph) and homozygous glutamic acid (E) at codon 219 (right graph). Arrow indicates the heterozygote of S97N.
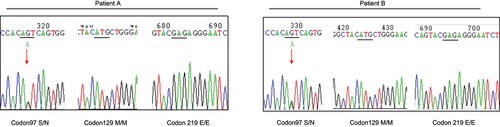
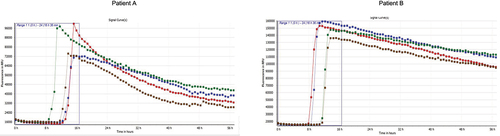
Figure 2. The spectra of CSF RT-QuIC assays. A 15 µl CSF sample was added to 85 µl of reaction mixture containing 1 mg/mL rHarPrP 90–231 into the each well of a 96 well plate. The assays were conducted in FLUOstar OMEGA plate reader (BMG Labtech, Germany). Each sample consists of four replicates (wells). Y-axis represents relative fluorescent unit (rfu, ThT value). X-axis represents the time (h) post-reaction.