
Figures & data
Table 1. Current state of biomarkers for prion diseases.
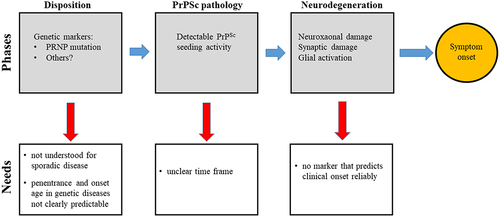
Figure 1. The phases of preclinical prion disease.
The figure is a flow chart with text boxes, indicating the steps of prion disease evolution from disposition to PrPSc pathology to neurodegeneration to symptom onset (left to right, upper image). Below, text boxes indicate unanswered questions related to these steps, such as the relevance and penetrance of genetic risk factors, the timeframes of each subclinical stage, and the lack of available biomarkers to predict clinical onset reliably.
Data availability statement
Data sharing is not applicable to this article as no new data were created or analysed for this narrative review article.