704
Views
9
CrossRef citations to date
0
Altmetric
Research Paper

Osteoprotegerin disrupts peripheral adhesive structures of osteoclasts by modulating Pyk2 and Src activities

, , , , , , , , , , & show all
Pages 299-309 | Received 01 Jun 2015, Accepted 04 Dec 2015, Published online: 10 Mar 2016

Figures & data

Figure 1. Inhibitory effects of OPG on osteoclast differentiation. RAW264.7 cells were suspended in α-MEM containing 10% FBS, 30 ng/mL RANKL and 25 ng/mL M-CSF. After 48 h of incubation, the medium was changed to serum-free α-MEM containing the 2 cytokines the cells were cultured for an additional 24 h. Next, OPG (0, 20, 40 and 80 ng/mL) was added and incubated for 24 h. (A) Cells were fixed and stained for TRAP (Magnification ×200, Scale bar = 50 μm) (B) TRAP-positive multinucleated cells (TRAP+) were observed by inverted phase contrast microscopy and counted (Magnification ×100). The results are expressed as the mean ± SD. **p < 0.01 and *p < 0.05 versus control.
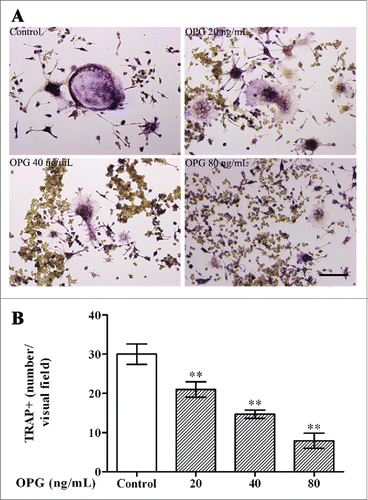
Figure 1. Inhibitory effects of OPG on osteoclast differentiation. RAW264.7 cells were suspended in α-MEM containing 10% FBS, 30 ng/mL RANKL and 25 ng/mL M-CSF. After 48 h of incubation, the medium was changed to serum-free α-MEM containing the 2 cytokines the cells were cultured for an additional 24 h. Next, OPG (0, 20, 40 and 80 ng/mL) was added and incubated for 24 h. (A) Cells were fixed and stained for TRAP (Magnification ×200, Scale bar = 50 μm) (B) TRAP-positive multinucleated cells (TRAP+) were observed by inverted phase contrast microscopy and counted (Magnification ×100). The results are expressed as the mean ± SD. **p < 0.01 and *p < 0.05 versus control.

Figure 2. Retraction of adhesive structures in OCs induced by OPG. (A) OPG-induced adhesive region detachment in OC examined by SEM. OCs were cultured on glass coverslips with (c-f) or without (a, b) collagen-I treatment. Various concentrations of OPG (0 (b, c), 20 (d), 40 (e) and 80 (f) ng/mL) were added for 24 h. White arrows indicate lamellipodia; white arrowheads indicate filopodia. (B) Dynamic monitoring of OCs treated with OPG using impedance technology. Cell index (CI) values were normalized to the time point of administration. Black arrow: OPG addition. Representative data are averaged from 3 wells. All experiments were repeated at least 3 times.
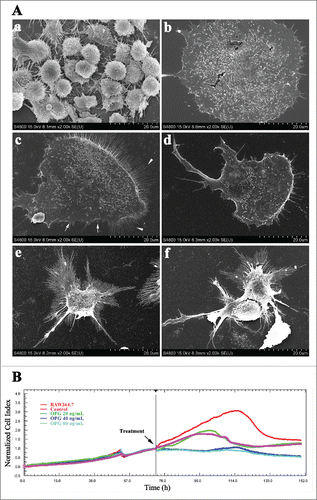
Figure 2. Retraction of adhesive structures in OCs induced by OPG. (A) OPG-induced adhesive region detachment in OC examined by SEM. OCs were cultured on glass coverslips with (c-f) or without (a, b) collagen-I treatment. Various concentrations of OPG (0 (b, c), 20 (d), 40 (e) and 80 (f) ng/mL) were added for 24 h. White arrows indicate lamellipodia; white arrowheads indicate filopodia. (B) Dynamic monitoring of OCs treated with OPG using impedance technology. Cell index (CI) values were normalized to the time point of administration. Black arrow: OPG addition. Representative data are averaged from 3 wells. All experiments were repeated at least 3 times.

Figure 3. OPG-induced dose-dependent decrease in tyrosine phosphorylation in Pyk2 and activation of Src. OCs were cultured in 6-well plates with collagen I coating and treated with the indicated amount of OPG for 24 h. (A) OCs were lysed and immunoblotted with anti-phosphotyrosine antibody, anti-Pyk2 antibody, anti-Pyk2 phosphotyrosine 402 antibody and β-actin antibody. (C) The proteins were subjected to Western blotting with anti-phosphotyrosine antibody and an anti-Pyk2 antibody. The membrane was then stripped and reprobed with an anti-Src antibody, anti-Src pTyr 416 antibody, anti-Src pTyr 527 antibody, anti-Src antibody and anti-β-actin antibody as a loading control. (B, D) The amount of protein was quantified by densitometry, and was corrected for sample loading based on the amount of protein and expressed as fold increase or decrease relative to the control lane. Each blot is representative of at least 3 replicate experiments.
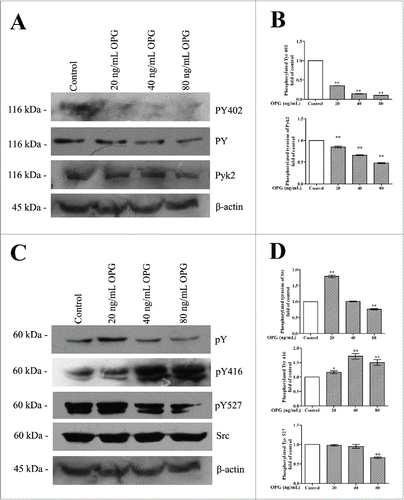
Figure 3. OPG-induced dose-dependent decrease in tyrosine phosphorylation in Pyk2 and activation of Src. OCs were cultured in 6-well plates with collagen I coating and treated with the indicated amount of OPG for 24 h. (A) OCs were lysed and immunoblotted with anti-phosphotyrosine antibody, anti-Pyk2 antibody, anti-Pyk2 phosphotyrosine 402 antibody and β-actin antibody. (C) The proteins were subjected to Western blotting with anti-phosphotyrosine antibody and an anti-Pyk2 antibody. The membrane was then stripped and reprobed with an anti-Src antibody, anti-Src pTyr 416 antibody, anti-Src pTyr 527 antibody, anti-Src antibody and anti-β-actin antibody as a loading control. (B, D) The amount of protein was quantified by densitometry, and was corrected for sample loading based on the amount of protein and expressed as fold increase or decrease relative to the control lane. Each blot is representative of at least 3 replicate experiments.

Figure 4. Effects of OPG on osteoclast morphology and distribution of Pyk2, Src and vinculin in OCs. Cells were plated and cultured on coverslips as described in the Methods. Cells treated with 40 ng/mL OPG for 24 h (lower images), or untreated (upper images), were fixed and stained for DAPI, F-actin and either p-Pyk2 402, Pyk2, p-Src(416), p-Src(527), Src or vinculin and examined by confocal immunofluorescence microscopy. (B, E, F) In untreated OCs, Pyk2, Src and vinculin were enriched in the peripheral actin-rich ring. Treatment with OPG for 24 h disrupted the peripheral actin ring and induced the redistribution of all 3 proteins to a more diffuse pattern throughout the cell interior. (A, C, D) OPG-induced signaling modulated Pyk2 and Src tyrosine phosphorylation states, causing a decrease in Tyr 402 Pyk2 and Tyr 527 Src labeling and an increase in Tyr 416 Src labeling at peripheral and central regions. OPG disrupted their co-localization with podosome in both regions. Scale bar = 20 μm.
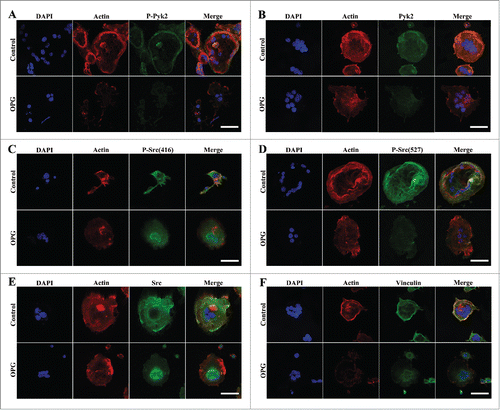
Figure 4. Effects of OPG on osteoclast morphology and distribution of Pyk2, Src and vinculin in OCs. Cells were plated and cultured on coverslips as described in the Methods. Cells treated with 40 ng/mL OPG for 24 h (lower images), or untreated (upper images), were fixed and stained for DAPI, F-actin and either p-Pyk2 402, Pyk2, p-Src(416), p-Src(527), Src or vinculin and examined by confocal immunofluorescence microscopy. (B, E, F) In untreated OCs, Pyk2, Src and vinculin were enriched in the peripheral actin-rich ring. Treatment with OPG for 24 h disrupted the peripheral actin ring and induced the redistribution of all 3 proteins to a more diffuse pattern throughout the cell interior. (A, C, D) OPG-induced signaling modulated Pyk2 and Src tyrosine phosphorylation states, causing a decrease in Tyr 402 Pyk2 and Tyr 527 Src labeling and an increase in Tyr 416 Src labeling at peripheral and central regions. OPG disrupted their co-localization with podosome in both regions. Scale bar = 20 μm.

Figure 5. The increase of Src/Pyk2 association in OCs after OPG treatment. Cells were plated and cultured on coverslips as described in the Methods. Cells treated with 40 ng/mL OPG for 24 h (lower images), or untreated (upper images), were fixed and stained for DAPI, Src and either p-Pyk2 402 or Pyk2 and examined by confocal immunofluorescence microscopy. (A) Distribution of p-Pyk2 402 and Src. (B) Distribution of Pyk and Src. OPG treatment inhanced the colocalization of Pyk2 and Src in the central region of OCs. Scale bar = 20 μm.
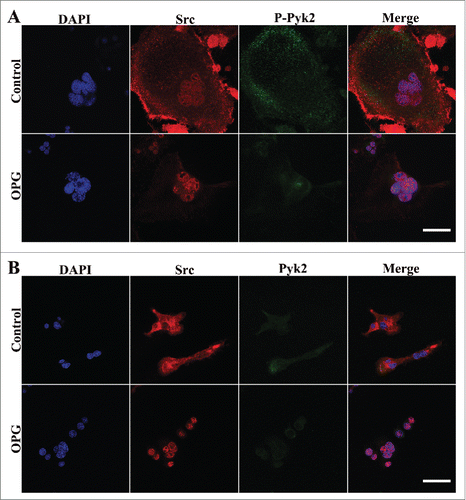
Figure 5. The increase of Src/Pyk2 association in OCs after OPG treatment. Cells were plated and cultured on coverslips as described in the Methods. Cells treated with 40 ng/mL OPG for 24 h (lower images), or untreated (upper images), were fixed and stained for DAPI, Src and either p-Pyk2 402 or Pyk2 and examined by confocal immunofluorescence microscopy. (A) Distribution of p-Pyk2 402 and Src. (B) Distribution of Pyk and Src. OPG treatment inhanced the colocalization of Pyk2 and Src in the central region of OCs. Scale bar = 20 μm.

Reprints and Corporate Permissions

Please note: Selecting permissions does not provide access to the full text of the article, please see our help page How do I view content?

To request a reprint or corporate permissions for this article, please click on the relevant link below:

Academic Permissions

Please note: Selecting permissions does not provide access to the full text of the article, please see our help page How do I view content?

Obtain permissions instantly via Rightslink by clicking on the button below:

If you are unable to obtain permissions via Rightslink, please complete and submit this Permissions form. For more information, please visit our Permissions help page.