890
Views
4
CrossRef citations to date
0
Altmetric
Research Paper

aPKCζ affects directed cell migration through the regulation of myosin light chain phosphorylation

, , &
Pages 347-359 | Received 20 May 2016, Accepted 11 Aug 2016, Published online: 14 Sep 2016

Figures & data

Figure 1. aPKCζ affected the acto-NMII cytoskeleton. aPKCζ−/− and control cells were seeded on coverslips (i.e., dispersed cells) (A) or subjected to wound scratch assay (B), and stained for F-actin, using Rhodamine-Phalloidin, and for NMIIA, using C-terminal specific antibody and secondary antibody conjugated to Cy2. Bars are 20μm. (C) aPKCζ−/− and control cells were subjected to Triton X-100 solubility assay, and the percentages of total NMIIA, NMIIB, and actin in the soluble and insoluble fractions were determined, as described in Materials and Methods. Values represent the mean ± SEM for 4 independent experiments, * p < 0.05, ** p < 0.01, values are aPKCζ−/− cells compared with control cells.
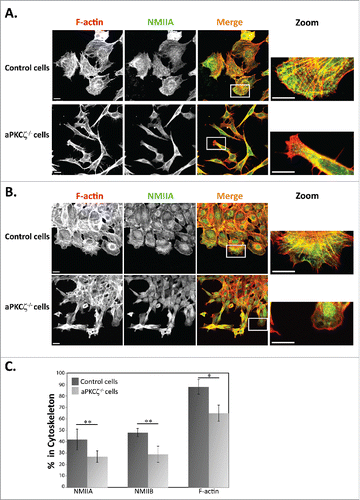
Figure 1. aPKCζ affected the acto-NMII cytoskeleton. aPKCζ−/− and control cells were seeded on coverslips (i.e., dispersed cells) (A) or subjected to wound scratch assay (B), and stained for F-actin, using Rhodamine-Phalloidin, and for NMIIA, using C-terminal specific antibody and secondary antibody conjugated to Cy2. Bars are 20μm. (C) aPKCζ−/− and control cells were subjected to Triton X-100 solubility assay, and the percentages of total NMIIA, NMIIB, and actin in the soluble and insoluble fractions were determined, as described in Materials and Methods. Values represent the mean ± SEM for 4 independent experiments, * p < 0.05, ** p < 0.01, values are aPKCζ−/− cells compared with control cells.

Figure 2. aPKCζ is required for proper cell adhesion. (A) aPKCζ−/− and control cells were subjected to wound scratch assay and immunostained with anti-paxillin antibody. Bars are 20 µm. (B) Quantification of the amount of pY118-paxillin. Lysates from aPKCζ−/− and control cells were subjected to Western blot analysis using anti-paxillin and anti-pY118-paxillin antibodies. The amounts of paxillin were normalized relative to actin. Bands were analyzed by densitometry using ImageJ. Paxillin phosphorylation was calculated as the ratio of phosphorylated paxillin to total paxillin. Values represent the mean ± SEM for 4 independent experiments, * p < 0.05, values are aPKCζ−/− cells compared with control cells. Pax, paxillin and pY118-pax, pY118-paxillin. (C) aPKCζ−/− and control cells were seeded on dishes, and after 2.5 h phase-contrast images of the cells were taken by confocal microscopy. Arrows indicate rounded detached cells and arrowheads indicate adhered cells. Bars are 50 µm. (D) Quantification of adhered cells. Adhered and rounded detached cells in 15 randomly-chosen fields were counted and the percentage of adhered cells relative to the total number of cells in each field was calculated. Values represent the mean ± SEM for 4 independent experiments subjected to 2-tailed, 2-sampled unequal variance Student's t test, *** p < 0.001, values are aPKCζ−/− cells compared with control cells.
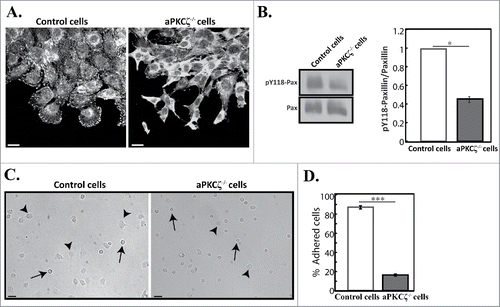
Figure 2. aPKCζ is required for proper cell adhesion. (A) aPKCζ−/− and control cells were subjected to wound scratch assay and immunostained with anti-paxillin antibody. Bars are 20 µm. (B) Quantification of the amount of pY118-paxillin. Lysates from aPKCζ−/− and control cells were subjected to Western blot analysis using anti-paxillin and anti-pY118-paxillin antibodies. The amounts of paxillin were normalized relative to actin. Bands were analyzed by densitometry using ImageJ. Paxillin phosphorylation was calculated as the ratio of phosphorylated paxillin to total paxillin. Values represent the mean ± SEM for 4 independent experiments, * p < 0.05, values are aPKCζ−/− cells compared with control cells. Pax, paxillin and pY118-pax, pY118-paxillin. (C) aPKCζ−/− and control cells were seeded on dishes, and after 2.5 h phase-contrast images of the cells were taken by confocal microscopy. Arrows indicate rounded detached cells and arrowheads indicate adhered cells. Bars are 50 µm. (D) Quantification of adhered cells. Adhered and rounded detached cells in 15 randomly-chosen fields were counted and the percentage of adhered cells relative to the total number of cells in each field was calculated. Values represent the mean ± SEM for 4 independent experiments subjected to 2-tailed, 2-sampled unequal variance Student's t test, *** p < 0.001, values are aPKCζ−/− cells compared with control cells.

Figure 3. aPKCζ affects persistence and speed of cell movement. (A) aPKCζ−/− and control cells were seeded on 2-well chamber coated with Collagen I. After wounding, the cells were tracked using time-lapse confocal microscopy at 30 min intervals. The paths of 10 randomly chosen cells were plotted for each experimental group. Paths are oriented in such a way that the start point is normalized to the origin. (B) the persistence of migration and (C) the speed of migration were extracted from the track plots. Persistence is defined as the ratio of the vectorial distance traveled to the total path length described by the cell. Values represent the mean ± SEM for n > 30 track plots. Persistence and speed, *** p < 0.001, values are aPKCζ−/− cells compared with control cells.
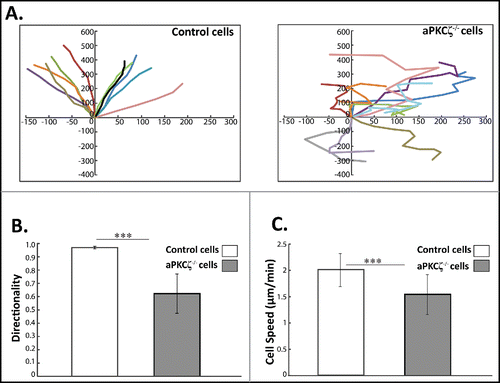
Figure 3. aPKCζ affects persistence and speed of cell movement. (A) aPKCζ−/− and control cells were seeded on 2-well chamber coated with Collagen I. After wounding, the cells were tracked using time-lapse confocal microscopy at 30 min intervals. The paths of 10 randomly chosen cells were plotted for each experimental group. Paths are oriented in such a way that the start point is normalized to the origin. (B) the persistence of migration and (C) the speed of migration were extracted from the track plots. Persistence is defined as the ratio of the vectorial distance traveled to the total path length described by the cell. Values represent the mean ± SEM for n > 30 track plots. Persistence and speed, *** p < 0.001, values are aPKCζ−/− cells compared with control cells.

Figure 4. aPKCζ is required for EGF-dependent MRLC phosphorylation. (A) aPKCζ−/− and control cells were stimulated with EGF, and at the indicated time point the cells were lysed in SDS-PAGE sample buffer divided into 2 samples that were subjected to Western blot analysis. One sample was probed with anti-MRLC antibodies and the other anti-pMRLC antibodies. Shown are representative Western blots. (B) Densitometry analysis of Western blots. Bands were analyzed by densitometry using ImageJ and the relative amounts of pMRLC to total MRLC are shown. Values represent the mean ± SEM for 5 independent experiments.
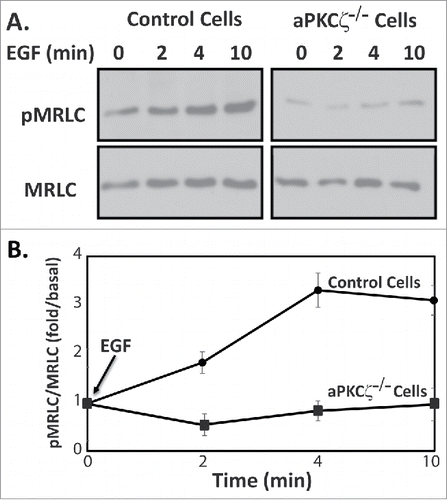
Figure 4. aPKCζ is required for EGF-dependent MRLC phosphorylation. (A) aPKCζ−/− and control cells were stimulated with EGF, and at the indicated time point the cells were lysed in SDS-PAGE sample buffer divided into 2 samples that were subjected to Western blot analysis. One sample was probed with anti-MRLC antibodies and the other anti-pMRLC antibodies. Shown are representative Western blots. (B) Densitometry analysis of Western blots. Bands were analyzed by densitometry using ImageJ and the relative amounts of pMRLC to total MRLC are shown. Values represent the mean ± SEM for 5 independent experiments.

Figure 5. ROCK increase MRLC phosphorylation upon EGF stimulation. (A) ROCK but not MLCK phosphorylates MRLC upon EGF stimulation. aPKCζ−/− and control cells were preincubated with ML-7, Y-27632, or both, stimulated with EGF for 4 min, lysed in SDS-PAGE sample buffer, divided into 2 samples that were subjected to Western blot analysis, One sample was probed with anti-MRLC antibodies and the other with anti-pMRLC antibodies. Shown are representative Western blots. The relative amounts of pMRLC to total MRLC are shown. Values represent the mean ± SEM for 5 independent experiments, ** p < 0.01, values are compared with control cells. (B) aPKCζ is required for EGF-dependent phosphorylation of MYPT. aPKCζ−/− and control cells were stimulated with EGF, and at the indicated time point cells were lysed in SDS-PAGE sample buffer and subjected to Western blot analysis with anti-pMYPT and anti-actin antibodies. Shown are representative Western blots. (B) Densitometry analysis of Western blots. The relative amounts of pMYPT to total actin are shown. Values represent the mean ± SEM for n = 3.
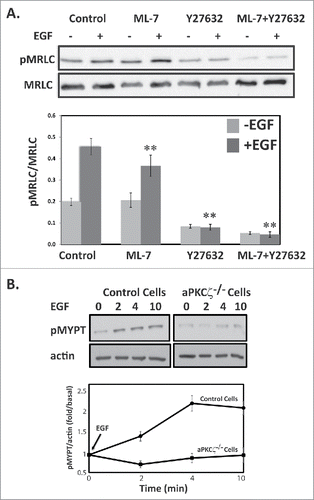
Figure 5. ROCK increase MRLC phosphorylation upon EGF stimulation. (A) ROCK but not MLCK phosphorylates MRLC upon EGF stimulation. aPKCζ−/− and control cells were preincubated with ML-7, Y-27632, or both, stimulated with EGF for 4 min, lysed in SDS-PAGE sample buffer, divided into 2 samples that were subjected to Western blot analysis, One sample was probed with anti-MRLC antibodies and the other with anti-pMRLC antibodies. Shown are representative Western blots. The relative amounts of pMRLC to total MRLC are shown. Values represent the mean ± SEM for 5 independent experiments, ** p < 0.01, values are compared with control cells. (B) aPKCζ is required for EGF-dependent phosphorylation of MYPT. aPKCζ−/− and control cells were stimulated with EGF, and at the indicated time point cells were lysed in SDS-PAGE sample buffer and subjected to Western blot analysis with anti-pMYPT and anti-actin antibodies. Shown are representative Western blots. (B) Densitometry analysis of Western blots. The relative amounts of pMYPT to total actin are shown. Values represent the mean ± SEM for n = 3.

Figure 6. aPKCζ is required for EGF-dependent RhoA activation. (A) Lysates aPKCζ−/− and control cells that were stimulated with EGF for 4 min, were subjected to affinity precipitation with GST-Rhotekin beads. Proteins bound to GST-Rhotekin beads (RhoA-GTP) and cell lysate (total RhoA) were separated on SDS-PAGE and immunoblotted for RhoA. (B) Relative amounts of RhoA-GTP to RhoA are shown. Values represent the mean ± SEM for 4 independent experiments, *** p < 0.001, values are aPKCζ−/− cells compared with control cells. (C) aPKCζ−/− and control cells were placed on cover slips, stimulated with EGF for 4 min, stained with anti-RhoA antibodies, and secondary antibody conjugated to Cy2. Bars are 10 μm.
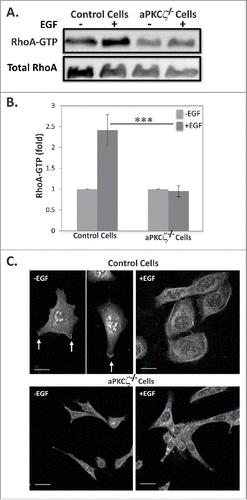
Figure 6. aPKCζ is required for EGF-dependent RhoA activation. (A) Lysates aPKCζ−/− and control cells that were stimulated with EGF for 4 min, were subjected to affinity precipitation with GST-Rhotekin beads. Proteins bound to GST-Rhotekin beads (RhoA-GTP) and cell lysate (total RhoA) were separated on SDS-PAGE and immunoblotted for RhoA. (B) Relative amounts of RhoA-GTP to RhoA are shown. Values represent the mean ± SEM for 4 independent experiments, *** p < 0.001, values are aPKCζ−/− cells compared with control cells. (C) aPKCζ−/− and control cells were placed on cover slips, stimulated with EGF for 4 min, stained with anti-RhoA antibodies, and secondary antibody conjugated to Cy2. Bars are 10 μm.

Figure 7. aPKCζ affects the spatial organization of pMRLC. aPKCζ−/− and control cells were subjected to wound scratch assay (A) or seeded on coverslips and stimulated with EGF for 4 min (B). Cells were stained for F-actin, using Rhodamine-Phalloidin, and with anti-pMRLC antibody and secondary antibody conjugated to Alexa flour 488. Bars are 20 μm.
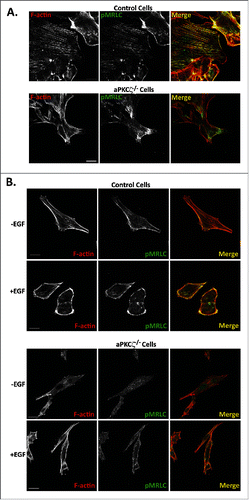
Figure 7. aPKCζ affects the spatial organization of pMRLC. aPKCζ−/− and control cells were subjected to wound scratch assay (A) or seeded on coverslips and stimulated with EGF for 4 min (B). Cells were stained for F-actin, using Rhodamine-Phalloidin, and with anti-pMRLC antibody and secondary antibody conjugated to Alexa flour 488. Bars are 20 μm.
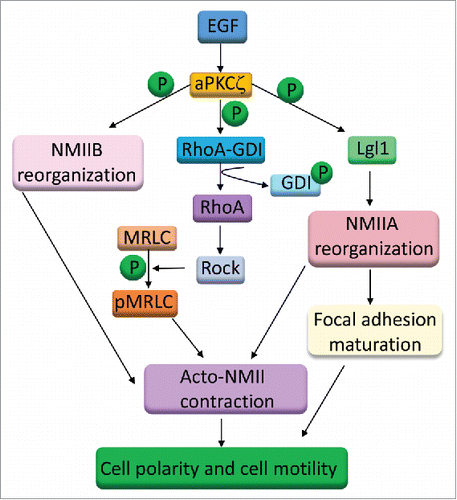
Figure 8. A model for the role of aPKCζ in cell migration. aPKCζ may affect cell migration by multiple mechanisms: through the phosphorylation of GDI and activation of RhoA, through the phosphorylation of NMIIB heavy chains, and through the phosphorylation of Lgl1.

Figure 8. A model for the role of aPKCζ in cell migration. aPKCζ may affect cell migration by multiple mechanisms: through the phosphorylation of GDI and activation of RhoA, through the phosphorylation of NMIIB heavy chains, and through the phosphorylation of Lgl1.
Supplemental material

Supplemental_materials.zip

Download Zip (6.8 MB)

Reprints and Corporate Permissions

Please note: Selecting permissions does not provide access to the full text of the article, please see our help page How do I view content?

To request a reprint or corporate permissions for this article, please click on the relevant link below:

Academic Permissions

Please note: Selecting permissions does not provide access to the full text of the article, please see our help page How do I view content?

Obtain permissions instantly via Rightslink by clicking on the button below:

If you are unable to obtain permissions via Rightslink, please complete and submit this Permissions form. For more information, please visit our Permissions help page.