1,270
Views
7
CrossRef citations to date
0
Altmetric
Research Paper

Involvement of Rho GAP GRAF1 in maintenance of epithelial phenotype

, , , &
Pages 367-383 | Received 24 Aug 2015, Accepted 18 Aug 2016, Published online: 04 Nov 2016

Figures & data

Figure 1. GRAF1 knockdown in MCF10A cells infected with lentivirus containing shRNA directed against GRAF1. (A) Localization of GRAF1 (left) and of E-cadherin (right) in control cells. (B) GRAF1 shRNA-expressing MCF10A cells (left) visualized by staining with GRAF1 antibodies. Note the presence of GRAF1 in control cells and its significant decrease upon shRNA expression. The level of junctional E-cadherin is high in control cells (A, right), but decreased upon GRAF1 depletion (B, right). Note some cells demonstrating high E-cadherin intensity (arrow). Scale bar: 5 μm. In insets: Islands of control (A, right) and GRAF1-depleted cells (B, right). The cell-cell junctions are visualized by E-cadherin-antibody. Notice that morphology of epithelial islands which became elongated upon GRAF1 depletion. Scale bar: 5 μm. (C) Left: Validation of siRNA-mediated GRAF1 knockdown. Western blot shows significant decrease in expression of heavier GRAF1 splicing B isoform and some decrease of A isoform. Middle: Quantification of expression of the GRAF1 protein (heavier isoform) by RT-PCR; Right: Validation of GRAF1 knockdown in the stable shGRAF1 expressing line.
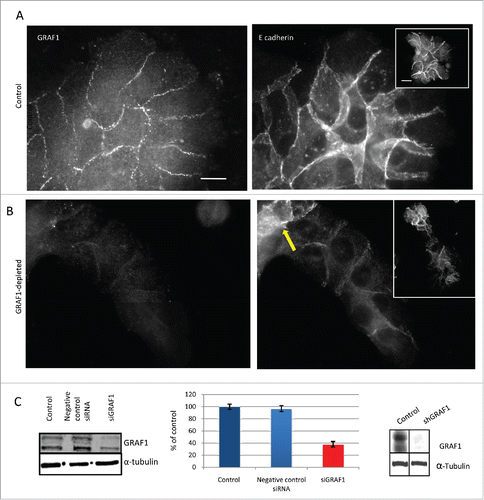
Figure 1. GRAF1 knockdown in MCF10A cells infected with lentivirus containing shRNA directed against GRAF1. (A) Localization of GRAF1 (left) and of E-cadherin (right) in control cells. (B) GRAF1 shRNA-expressing MCF10A cells (left) visualized by staining with GRAF1 antibodies. Note the presence of GRAF1 in control cells and its significant decrease upon shRNA expression. The level of junctional E-cadherin is high in control cells (A, right), but decreased upon GRAF1 depletion (B, right). Note some cells demonstrating high E-cadherin intensity (arrow). Scale bar: 5 μm. In insets: Islands of control (A, right) and GRAF1-depleted cells (B, right). The cell-cell junctions are visualized by E-cadherin-antibody. Notice that morphology of epithelial islands which became elongated upon GRAF1 depletion. Scale bar: 5 μm. (C) Left: Validation of siRNA-mediated GRAF1 knockdown. Western blot shows significant decrease in expression of heavier GRAF1 splicing B isoform and some decrease of A isoform. Middle: Quantification of expression of the GRAF1 protein (heavier isoform) by RT-PCR; Right: Validation of GRAF1 knockdown in the stable shGRAF1 expressing line.

Figure 2. Morphology and motility of GRAF1-depleted cells. (A) E-cadherin antibody staining reveals that a control colony of MCF10A cells (top) displays, on average, higher levels of E-cadherin at cell-cell junctions, than a colony from a GRAF1-depleted MCF10A cell culture (bottom). Notice, however, that some cells in the GRAF1-knockdown colony demonstrate relatively high E-cadherin levels. Scale bar: 10 μm. (B) Live-cell imaging of control (top) and GRAF1-depleted MCF10A cells (bottom). Sequential position of a single cell in the island is marked by borders colored in spectrum order (red = 0 time, orange = 4 hours, yellow = 8 hours, green = 12 hours, blue = 20 hours). Control cells are not elongated; rather, form approximately circular islands. Displacement of cells in the island during the 24-hour observation period did not exceed the cell diameter. GRAF1-depleted cells form an elongated island, and move from the interior of the island to the cell periphery. Scale bar: 10 μm. (C) Morphological characteristics of control and GRAF1-depleted cells and their colonies. Left: Cell aspect ratio. Middle: Colony aspect ratio. Right: Cell area. Notice that both cells and their colonies became elongated upon GRAF1 depletion, while the cell's projected area did not change. p values were calculated by a Student's t-test. Measurements were performed in at least 50 cells per sample. (D) Quantification of E-cadherin staining intensity at cell-cell contacts. Image analysis was performed using software designed in-house. Measurements were performed for 50 fields in each sample. Decrease of E-cadherin levels upon GRAF1 knockdown is highly statistically significant (p < 0.001). (E) Increase of migratory velocity in GRAF1-depleted cells, as compared to control cells and GRAF1-transfected cells. Velocities were measured by tracking the centers of the cell nuclei. Quantification included 100 cells for each sample and was undertaken using a specially designed tracking program (see “Materials and methods”).
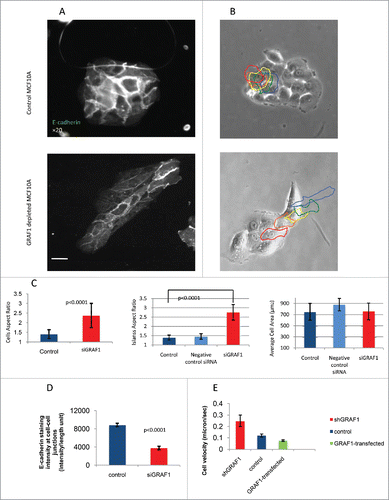
Figure 2. Morphology and motility of GRAF1-depleted cells. (A) E-cadherin antibody staining reveals that a control colony of MCF10A cells (top) displays, on average, higher levels of E-cadherin at cell-cell junctions, than a colony from a GRAF1-depleted MCF10A cell culture (bottom). Notice, however, that some cells in the GRAF1-knockdown colony demonstrate relatively high E-cadherin levels. Scale bar: 10 μm. (B) Live-cell imaging of control (top) and GRAF1-depleted MCF10A cells (bottom). Sequential position of a single cell in the island is marked by borders colored in spectrum order (red = 0 time, orange = 4 hours, yellow = 8 hours, green = 12 hours, blue = 20 hours). Control cells are not elongated; rather, form approximately circular islands. Displacement of cells in the island during the 24-hour observation period did not exceed the cell diameter. GRAF1-depleted cells form an elongated island, and move from the interior of the island to the cell periphery. Scale bar: 10 μm. (C) Morphological characteristics of control and GRAF1-depleted cells and their colonies. Left: Cell aspect ratio. Middle: Colony aspect ratio. Right: Cell area. Notice that both cells and their colonies became elongated upon GRAF1 depletion, while the cell's projected area did not change. p values were calculated by a Student's t-test. Measurements were performed in at least 50 cells per sample. (D) Quantification of E-cadherin staining intensity at cell-cell contacts. Image analysis was performed using software designed in-house. Measurements were performed for 50 fields in each sample. Decrease of E-cadherin levels upon GRAF1 knockdown is highly statistically significant (p < 0.001). (E) Increase of migratory velocity in GRAF1-depleted cells, as compared to control cells and GRAF1-transfected cells. Velocities were measured by tracking the centers of the cell nuclei. Quantification included 100 cells for each sample and was undertaken using a specially designed tracking program (see “Materials and methods”).

Figure 3. Electron microscopy analysis of alterations in cell morphology and cell-cell junction organization upon GRAF1 knockdown. (A) Scanning electron microscopy images of the small colonies of control and GRAF1-depleted cells. Note that the colony of GRAF1 depleted cells, as well as individual cells, are more elongated. The “leading” cell (denoted by a white arrow) of the GRAF1 depleted colony displays a large lamellum and numerous filopodia. (B) Disruption of cell-cell contacts seen by transmission electron microscopy. Upper row: Note smaller desmososmes and less prominent arrays of intermediate filaments (presumable cytokeratin filaments) in GRAF1-depleted cells (yellow arrow in the right image), as compared to controls(arrowhead in the left image). Lower row: The control cells (left) are characterized by wide adherens junctions (arrowheads), while GRAF1-depleted cells (right) demonstrate instead open intercellular spaces with multiple microvilli (yellow arrow).
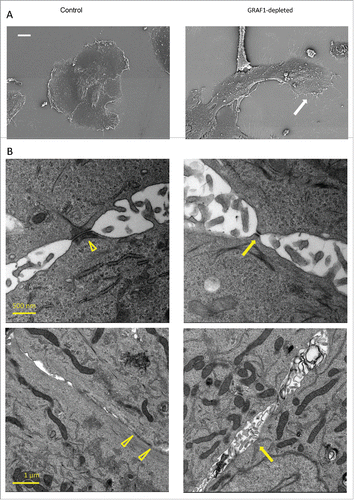
Figure 3. Electron microscopy analysis of alterations in cell morphology and cell-cell junction organization upon GRAF1 knockdown. (A) Scanning electron microscopy images of the small colonies of control and GRAF1-depleted cells. Note that the colony of GRAF1 depleted cells, as well as individual cells, are more elongated. The “leading” cell (denoted by a white arrow) of the GRAF1 depleted colony displays a large lamellum and numerous filopodia. (B) Disruption of cell-cell contacts seen by transmission electron microscopy. Upper row: Note smaller desmososmes and less prominent arrays of intermediate filaments (presumable cytokeratin filaments) in GRAF1-depleted cells (yellow arrow in the right image), as compared to controls(arrowhead in the left image). Lower row: The control cells (left) are characterized by wide adherens junctions (arrowheads), while GRAF1-depleted cells (right) demonstrate instead open intercellular spaces with multiple microvilli (yellow arrow).

Figure 4. Junctional and cytoskeletal changes following GRAF-1 depletion. (A) Upper row: GRAF1-depleted cells display larger focal adhesions (visualized by staining with paxillin antibody), as compared to control cells. Middle row: Zyxin is localized to focal adhesions and stress fibers. In GRAF1-depleted cells, stress fiber localization of zyxin is more prominent than in control cells (arrow). Lower row: Actin stress fibers (visualized by phalloidin staining and indicated by arrows) in GRAF1-depleted cells are more robust and form parallel arrays (yellow arrow), not observed in controls (white arrow).Scale bar: 5 μm. (B) Measurement of focal adhesion size in control and GRAF1- depleted cells. At least 50 cells from each sample were measured. Average size of focal adhesions in GRAF1-depleted cells is 1.5 larger than that of controls. (C) Quantification of zyxin-positive stress fibers in control and GRAF1-depleted cells; not less than 100 cells in about 25–30 microscope fields from each sample were analyzed. Note the increase of zyxin-positive stress fibers in GRAF1- depleted cells, as compared to controls (p < 0.0005 according Student's t-test).
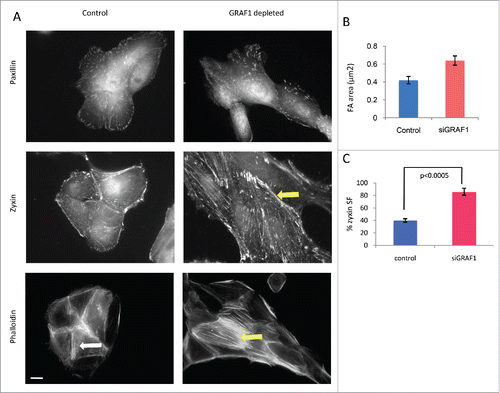
Figure 4. Junctional and cytoskeletal changes following GRAF-1 depletion. (A) Upper row: GRAF1-depleted cells display larger focal adhesions (visualized by staining with paxillin antibody), as compared to control cells. Middle row: Zyxin is localized to focal adhesions and stress fibers. In GRAF1-depleted cells, stress fiber localization of zyxin is more prominent than in control cells (arrow). Lower row: Actin stress fibers (visualized by phalloidin staining and indicated by arrows) in GRAF1-depleted cells are more robust and form parallel arrays (yellow arrow), not observed in controls (white arrow).Scale bar: 5 μm. (B) Measurement of focal adhesion size in control and GRAF1- depleted cells. At least 50 cells from each sample were measured. Average size of focal adhesions in GRAF1-depleted cells is 1.5 larger than that of controls. (C) Quantification of zyxin-positive stress fibers in control and GRAF1-depleted cells; not less than 100 cells in about 25–30 microscope fields from each sample were analyzed. Note the increase of zyxin-positive stress fibers in GRAF1- depleted cells, as compared to controls (p < 0.0005 according Student's t-test).

Figure 5. Markers of EMT in control and GRAF1-depleted MCF10A cells. (A) Increase in vimentin filament density, as visualized by immunofluorescence staining of control and GRAF1- depleted cells with anti-vimentin antibody. Scale bar: 5 μm. (B) Western blot with anti-vimentin antibody reveals an increase in vimentin expression in GRAF1-depleted versus control cells. (C) Loss of cytokeratin 14, following GRAF1 depletion. (D) A major decrease in cytokeratin 14 and 5 in GRAF1-depleted cells, indicated by Western blot. (E) Replacement of E-cadherin by N-cadherin upon GRAF1 depletion. Left column: E-cadherin contents at cell-cell junctions is significantly higher in control cells than in GRAF1-depleted cells. Middle column: N-cadherin contents in the same pair of colonies as seen in the upper panel. Note the significant increase in both cytoplasmic and junctional N-cadherin level in GRAF1-depleted cells, as compared to controls. Right column: Merged images of E-(green) and N-(red) cadherin in control and GRAF1-depleted cells. Nuclei are stained by DAPI (blue). Scale bar: 5 μm. (F) Western blot analysis of E- and N-cadherin contents, as well as markers of EMT Snail-2 /Snail-1 in control and GRAF1- depleted MCF10A cells. An increase in N-cadherin and EMT-characteristic transcriptional factors Snail-2 and Snail-1 is seen. Alpha-tubulin levels did not change upon GRAF1 depletion. (G) Quantification of the levels of expression of EMT markers in GRAF1-depleted cells is shown as percents of control. The α-tubulin level was used as a loading control; values representing the expression levels of all proteins of interest were normalized to the α-tubulin level.
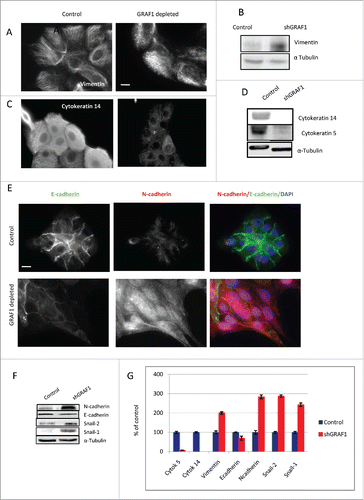
Figure 5. Markers of EMT in control and GRAF1-depleted MCF10A cells. (A) Increase in vimentin filament density, as visualized by immunofluorescence staining of control and GRAF1- depleted cells with anti-vimentin antibody. Scale bar: 5 μm. (B) Western blot with anti-vimentin antibody reveals an increase in vimentin expression in GRAF1-depleted versus control cells. (C) Loss of cytokeratin 14, following GRAF1 depletion. (D) A major decrease in cytokeratin 14 and 5 in GRAF1-depleted cells, indicated by Western blot. (E) Replacement of E-cadherin by N-cadherin upon GRAF1 depletion. Left column: E-cadherin contents at cell-cell junctions is significantly higher in control cells than in GRAF1-depleted cells. Middle column: N-cadherin contents in the same pair of colonies as seen in the upper panel. Note the significant increase in both cytoplasmic and junctional N-cadherin level in GRAF1-depleted cells, as compared to controls. Right column: Merged images of E-(green) and N-(red) cadherin in control and GRAF1-depleted cells. Nuclei are stained by DAPI (blue). Scale bar: 5 μm. (F) Western blot analysis of E- and N-cadherin contents, as well as markers of EMT Snail-2 /Snail-1 in control and GRAF1- depleted MCF10A cells. An increase in N-cadherin and EMT-characteristic transcriptional factors Snail-2 and Snail-1 is seen. Alpha-tubulin levels did not change upon GRAF1 depletion. (G) Quantification of the levels of expression of EMT markers in GRAF1-depleted cells is shown as percents of control. The α-tubulin level was used as a loading control; values representing the expression levels of all proteins of interest were normalized to the α-tubulin level.

Table 1. Number of soft agar colonies per field. Number of colonies was counted using x10 objective of Zeiss, Axioplan inverted microscope. Data of one typical experiment are presented.

Figure 6. Effect of GRAF1 expression on the phenotype of breast cancer-derived cell lines. (A) Seven different breast cancer lines demonstrate lower level of GRAF1 expression, as compared to non-malignant MCF10A cells. Alpha-tubulin is used as a loading control. The characteristics of the cell lines are described in Supplementary . (B) Levels of expression of EMT markers in neoplastically transformed BT-549 cells, before and after GRAF1 overexpression in these cells. Left: Western blot. Right: Quantification of protein expression levels, normalized to α-tubulin levels in corresponding cells.
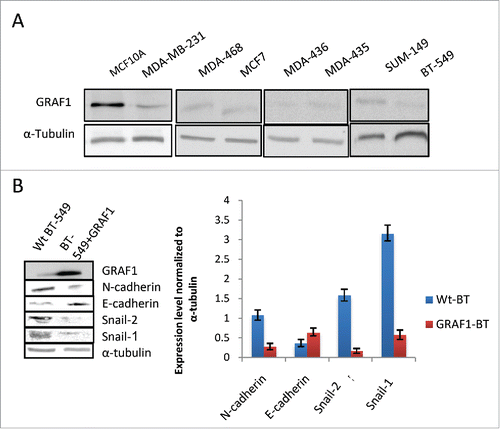
Figure 6. Effect of GRAF1 expression on the phenotype of breast cancer-derived cell lines. (A) Seven different breast cancer lines demonstrate lower level of GRAF1 expression, as compared to non-malignant MCF10A cells. Alpha-tubulin is used as a loading control. The characteristics of the cell lines are described in Supplementary Table 1. (B) Levels of expression of EMT markers in neoplastically transformed BT-549 cells, before and after GRAF1 overexpression in these cells. Left: Western blot. Right: Quantification of protein expression levels, normalized to α-tubulin levels in corresponding cells.

Figure 7. Activity of RhoA and Rac1 in control and GRAF1-depleted MCF10A cells. (A) GRAF1-depleted MCF10A cells sample showed a 75% increase in the levels of active RhoA, and a 40% decrease of active Rac1, as compared to control samples. The levels of RhoA and Rac1 activity were calculated as mentioned in Materials and Methods and expressed as percent of control. The level of the active RhoA was measured by a pull-down assay, using Rhotekin-RBD coated beads that bind the active (GTP-bound) RhoA with high affinity. Active Rac1 levels were measured by a pull-down assay, using PAK-PBD coated beads that bind the active (GTP-bound) Rac1, with high affinity. (B) The Western blot shows the level of active RhoA (left) and of active Rac1 (right) in the samples of cell lysate from control and shGRAF1-expressing cells (upper bands). GTP- and GDP-enriched cell lysates (“+GTP” and “+GDP,” respectively) were used as positive and negative controls. Amounts of pulled down, active RhoA and Rac1 were normalized relative to the total RhoA and Rac1 levels respectively, in the corresponding lysates.
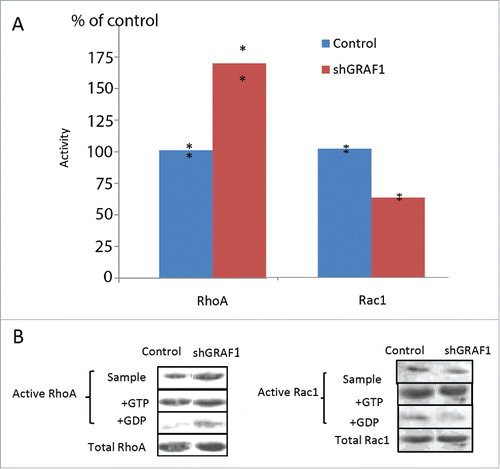
Figure 7. Activity of RhoA and Rac1 in control and GRAF1-depleted MCF10A cells. (A) GRAF1-depleted MCF10A cells sample showed a 75% increase in the levels of active RhoA, and a 40% decrease of active Rac1, as compared to control samples. The levels of RhoA and Rac1 activity were calculated as mentioned in Materials and Methods and expressed as percent of control. The level of the active RhoA was measured by a pull-down assay, using Rhotekin-RBD coated beads that bind the active (GTP-bound) RhoA with high affinity. Active Rac1 levels were measured by a pull-down assay, using PAK-PBD coated beads that bind the active (GTP-bound) Rac1, with high affinity. (B) The Western blot shows the level of active RhoA (left) and of active Rac1 (right) in the samples of cell lysate from control and shGRAF1-expressing cells (upper bands). GTP- and GDP-enriched cell lysates (“+GTP” and “+GDP,” respectively) were used as positive and negative controls. Amounts of pulled down, active RhoA and Rac1 were normalized relative to the total RhoA and Rac1 levels respectively, in the corresponding lysates.

Figure 8. Inhibition of Rho kinase partially rescues the adhesion phenotype in GRAF1-depleted cells. (A) A gradual increase in cell-cell junction intensity (upper panel) and a decrease in focal adhesion area (lower panel) were seen during 10 to 60 min incubation of GRAF1-depleted cells with the Rho-kinase inhibitor Y27632 at a 10 µM final concentration. Immunofluorescence staining with anti-E-cadherin and anti-zyxin antibodies. Scale bar: 10 μm. (B) The average intensity of E-cadherin staining at the cell-cell junctions in the Y27632-treated GRAF1-depleted cells approached 65% of the E-cadherin intensity at the cell-cell contacts of control cells. (C) Focal adhesion area (visualized by staining with antibody to zyxin) in Y27632-treated GRAF1-depleted cells become similar to those seen in control cells treated with Y27632.
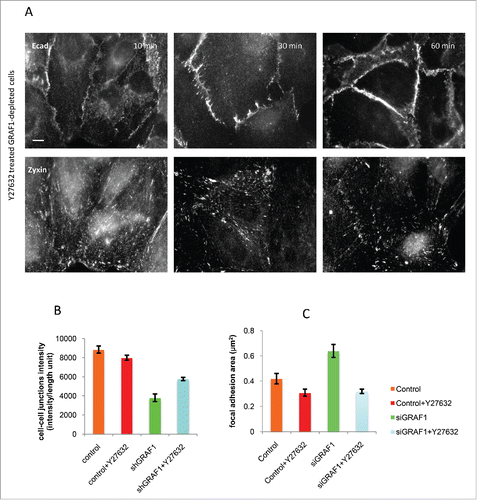
Figure 8. Inhibition of Rho kinase partially rescues the adhesion phenotype in GRAF1-depleted cells. (A) A gradual increase in cell-cell junction intensity (upper panel) and a decrease in focal adhesion area (lower panel) were seen during 10 to 60 min incubation of GRAF1-depleted cells with the Rho-kinase inhibitor Y27632 at a 10 µM final concentration. Immunofluorescence staining with anti-E-cadherin and anti-zyxin antibodies. Scale bar: 10 μm. (B) The average intensity of E-cadherin staining at the cell-cell junctions in the Y27632-treated GRAF1-depleted cells approached 65% of the E-cadherin intensity at the cell-cell contacts of control cells. (C) Focal adhesion area (visualized by staining with antibody to zyxin) in Y27632-treated GRAF1-depleted cells become similar to those seen in control cells treated with Y27632.
Supplemental material

Supplementary_materials.zip

Download Zip (40.6 MB)