2,140
Views
19
CrossRef citations to date
0
Altmetric
Research Paper

The isolation of morphologically intact and biologically active extracellular vesicles from the secretome of cancer-associated adipose tissue

, , , , , , , , , , & show all
Pages 196-204 | Received 26 Aug 2016, Accepted 03 Jan 2017, Published online: 01 Feb 2017

Figures & data

Figure 1. Schematic overview of the dUC-ODG protocol to isolate EVs from cancer-associated adipose tissue-derived conditioned medium (CMCAAT). Approximately 21 g of CAAT was ex vivo cultivated in control medium. CMCAAT was harvested, centrifuged and used for further isolation by a combination of differential ultracentrifugation followed by Optiprep density gradient centrifugation.
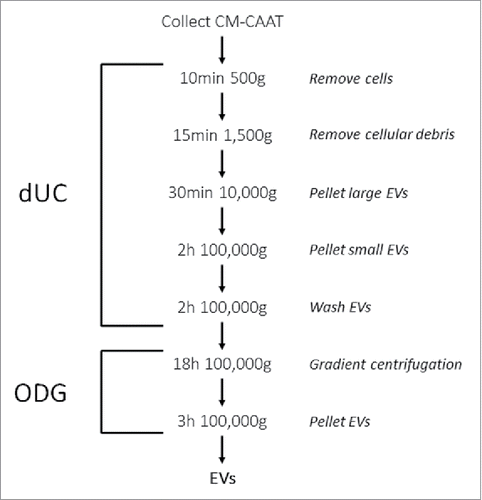
Figure 1. Schematic overview of the dUC-ODG protocol to isolate EVs from cancer-associated adipose tissue-derived conditioned medium (CMCAAT). Approximately 21 g of CAAT was ex vivo cultivated in control medium. CMCAAT was harvested, centrifuged and used for further isolation by a combination of differential ultracentrifugation followed by Optiprep density gradient centrifugation.

Figure 2. Protein analysis of (non) EV-enriched proteins. EVs were isolated from the conditioned medium of cancer-associated adipose tissue by the dUC-ODG protocol. Western blot analysis of (A) EV-enriched proteins (flotillin-1, CD9 and HSP70) and adipocyte-specific protein FABP-4 and (B) cell organelle and apoptotic body proteins (GM130, prohibitin and calreticulin).
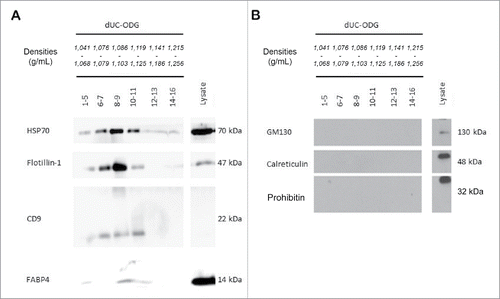
Figure 2. Protein analysis of (non) EV-enriched proteins. EVs were isolated from the conditioned medium of cancer-associated adipose tissue by the dUC-ODG protocol. Western blot analysis of (A) EV-enriched proteins (flotillin-1, CD9 and HSP70) and adipocyte-specific protein FABP-4 and (B) cell organelle and apoptotic body proteins (GM130, prohibitin and calreticulin).

Figure 3. Morphological characterization and quantification of EV preparations by electron microscopy (EM) and nanoparticle tracking analysis (NTA). EVs were isolated from the conditioned medium of cancer-associated adipose tissue by the dUC-ODG protocol. (A) Left: Wide-field EM picture of EVs of fractions 8–9 fsrom the density gradient corresponding to the density of 1.086–1.103 g/ml. Scale bar: 200 nm. Right: Zoom in on CD63-positive and negative EVs. (B) The calculated size distribution of EVs analyzed by NTA depicted as a mean (black line) with standard error (red shaded area). Total particle number, mean particle size and modus are shown.
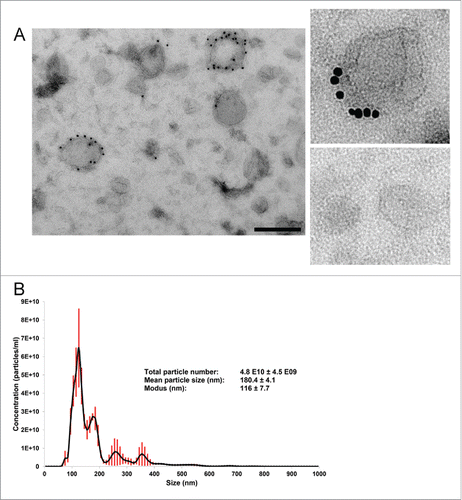
Figure 3. Morphological characterization and quantification of EV preparations by electron microscopy (EM) and nanoparticle tracking analysis (NTA). EVs were isolated from the conditioned medium of cancer-associated adipose tissue by the dUC-ODG protocol. (A) Left: Wide-field EM picture of EVs of fractions 8–9 fsrom the density gradient corresponding to the density of 1.086–1.103 g/ml. Scale bar: 200 nm. Right: Zoom in on CD63-positive and negative EVs. (B) The calculated size distribution of EVs analyzed by NTA depicted as a mean (black line) with standard error (red shaded area). Total particle number, mean particle size and modus are shown.

Figure 4. Stimulation of CREB transcription factor phosphorylation and sphere formation by EVs. EVs were isolated from the conditioned medium of cancer-associated adipose tissue by the dUC-ODG protocol. (A) Western blot analysis of phospho-CREB and total CREB from lysates of ZR75.1 cells under control conditions or treated by 1×10⁸ EVs. (B) The number of aggregates formed by MCF7 single cells seeded in ultra-low attachment plates under control conditions or treated by 5×10⁹ EVs for 24h. Each experiment was performed in quadruplicate.
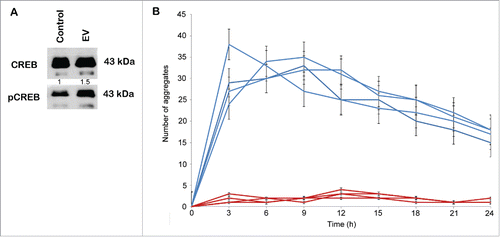
Figure 4. Stimulation of CREB transcription factor phosphorylation and sphere formation by EVs. EVs were isolated from the conditioned medium of cancer-associated adipose tissue by the dUC-ODG protocol. (A) Western blot analysis of phospho-CREB and total CREB from lysates of ZR75.1 cells under control conditions or treated by 1×10⁸ EVs. (B) The number of aggregates formed by MCF7 single cells seeded in ultra-low attachment plates under control conditions or treated by 5×10⁹ EVs for 24h. Each experiment was performed in quadruplicate.

Table 1. Characteristics of the dUC-ODG protocol implemented to isolate EVs from CMCAAT.

Supplemental material

Supplemental_materials.zip

Download Zip (31.4 MB)

Reprints and Corporate Permissions

Please note: Selecting permissions does not provide access to the full text of the article, please see our help page How do I view content?

To request a reprint or corporate permissions for this article, please click on the relevant link below:

Academic Permissions

Please note: Selecting permissions does not provide access to the full text of the article, please see our help page How do I view content?

Obtain permissions instantly via Rightslink by clicking on the button below:

If you are unable to obtain permissions via Rightslink, please complete and submit this Permissions form. For more information, please visit our Permissions help page.