Figures & data
Figure 1. Morphology of contact areas between leukemia cells and fibronectin-coated surface. Leukemia cell lines (a-f) or primary cells from leukemia patients (g-i) were seeded on FN-coated slides and incubated for 1 h at 37°C. The cell parts which are very close to the surface were visualized by interference reflection microscopy. The mean diameter of cells in suspension is 12–16 µm for cell lines and 6–9 µm for primary cells. Scale bars: 10 µm. Characteristic IRM images for leukemia/lymphoma cell lines OCI-AML3 (a), HEL (b), HL-60 (c), K562 (d), MOLM-7 (e), Karpas-299 (f). Primary cells from 3 different patients with AML are shown in (g-i).
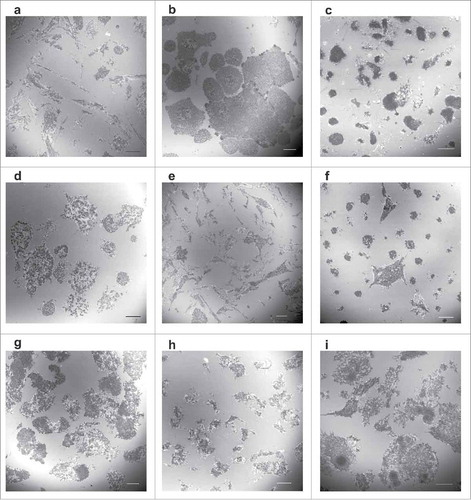
Figure 2. Expression levels of Src family kinases and of their active forms. Expression of c-Src, Lyn, Hck and Lck was assessed in human leukemia/lymphoma cell lines as well as in 2 human adherent cell lines (HeLa, HEK293T). The phospho-specific antibody against pSFK (Tyr416) recognizes an autophosphorylation site shared by all these kinases which serves as a marker of kinase activity. The same number of cells was harvested for all samples, actin was used as a control for total protein load.
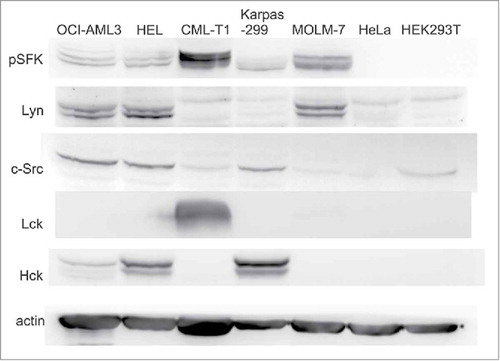
Figure 3. Effect of SFK inhibitors and cytochalasin D on cell attachment to fibronectin. A: Cells were pretreated with 100 nM dasatinib or 20 µM SKI-1 for 1 h and then seeded to FN-coated wells. The fraction of adhered cells was determined after 1 h incubation of the plate at 37°C. White bars: controls, gray bars: dasatinib, black bars: SKI-1. B: Cells were seeded on FN and left adhere for 1.5 h. Thereafter, inhibitors were added for additional 30 min at the same concentrations as in A. White bars: controls, gray bars: dasatinib, black bars: SKI-1. C: HEL cells were seeded into FN-coated wells. Dasatinib was added after 1.5 h to the corresponding wells, then 5 µM cytochalasin D or 20 µM SKI-1 was added after additional 30 min. The plate was further incubated for 1 h and the adhered cell fraction was determined thereafter. The level of phosphorylated SFK was assessed in parallel by western-blotting. All graphs show means and standard deviations from 3 to 7 independent experiments for each condition, each of them performed in quadruplets. The treated samples were compared with untreated controls using paired t-test: *p less than 0.05, **p less than 0.01, ***p less than 0.001.
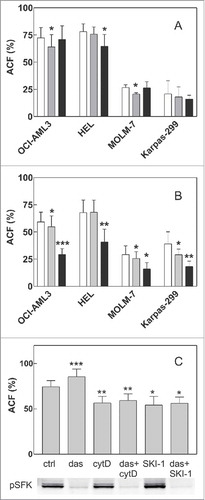
Figure 4. Effect of SFK inhibitors on Lyn activity. OCI-AML3 cells were treated with dasatinib or SKI-1, either in suspension (susp) or after adhesion to FN-coated surface (FN). Lyn activity was assessed from the extent of phosphorylation at Lyn autophosphorylation site (Tyr397) and on 2 known Lyn substrates, HS-1 and Pyk2. Lyn autophosphorylation was analyzed from bands at 53 and 56 kDa on western-blots incubated with pan anti-pSFK antibody. A-B: Representative western-blots from cells treated for 1 h with increasing concentrations of dasatinib (A) or SKI-1 (B). C: Summary results from 4 experiments performed with 20 µM SKI-1 or 100 nM dasatinib treatment of pre-adhered OCI-AML3 cells (cell binding to FN for 1.5 h, then 30 min inhibitor treatment). Note that the exposition time for different membranes was not the same and was optimized to show the changes in pSFK level under different conditions.
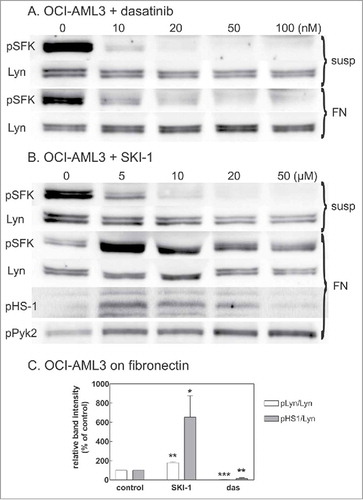
Figure 5. Monitoring of cell-FN interaction through microimpedance measurement. The effect of dasatinib (100 nM), cytochalasin D (5 µM) and SKI-1 (20 or 50 µM) is shown for adherent (HeLa, HEK293T) and leukemic (OCI-AML3, HEL) cells. The arrows indicate the time of inhibitor addition to cells on FN. The curves are means from well duplicates. The baseline values (before cell addition) were subtracted. In A, C and D, the resistance was normalized to 1 at a time point just before addition of inhibitors. In B, non-normalized values are shown. A: Effect of dasatinib or cytochalasin D addition on the microimpedance signal from adherent cells (left – HeLa, right – HEK293T). B: Effect of 1h dasatinib pretreatment on the microimpedance signal from attaching leukemia cells (left – OCI-AML3, right – HEL). C: Effect of dasatinib or cytochalasin D addition on the signal from leukemic cells (left – OCI-AML3, right – HEL). D: Effect of SKI-1 on the signal from leukemic cells (left – OCI-AML3, right – HEL).
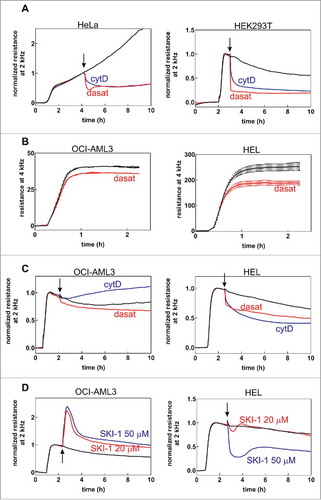
Figure 6. Localization of autophosphorylated Lyn kinase in cells treated with SKI-1. The cells were incubated for 1 h on fibronectin, then treated with 20 µM SKI-1 for 30 to 60 min. The sample was fixed and the active Lyn was detected using anti-phospho-SFK (Tyr416) and Alexa-488-conjugated secondary antibody. Red: actin polymers visualized by phalloidin, blue: nuclei (DAPI). IRM and IF from the same visual field are shown in each pair of images. A: OCI-AML3 cells, B: MOLM-7 cells. Scale bars: 10 µm.
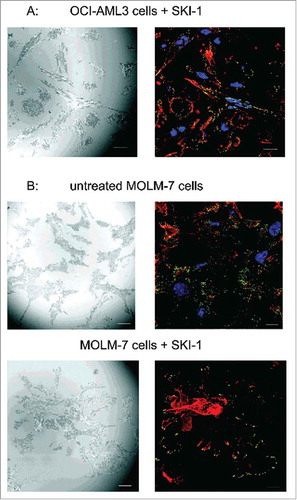
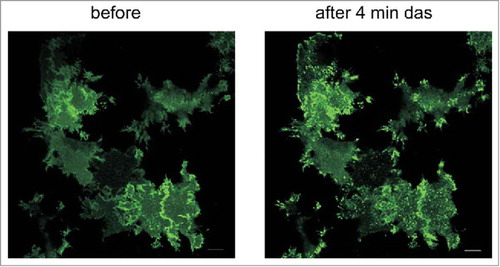
Figure 7. Changes in the distribution of Lyn-eGFP signal upon treatment of HeLa cells with dasatinib. HeLa cells were transfected with plasmid coding for Lyn-eGFP. The figure shows the fluorescence intensity from eGFP before and 4 min after treatment of cells with 100 nM dasatinib. Scale bars: 10 µm.