Figures & data
Figure 1. unc-53 gene activity is required for proper Distal tip cell migrations: (A) The graphic depicts the U-shaped morphology of the adult gonads and the three migratory phases of DTCs. Phase 1 commences during the L2 stage along the anteroposterior (AP) axes followed by Phase 2 in the L3 stage along the dorsoventral (DV) axes. Cessation of migration occurs in the L4 stage in the midbdoy region, where the two gonad arms migrate centripetally along the AP axes. Representative Differential Interference Contrast (DIC) micrograph of L4 stage animal, where midbody region () is on the left, with dorsal side up, displaying the normal U-shaped adult gonad morphology. (B) N2, wild type animal with proper U-shaped morphology of adult gonad posterior arm exhibiting the three migratory phases. (C) unc-53(n152) animal, exhibiting DTC phase 3 AP polarity reversal path-finding defect, where during phase 3 the posterior gonad arm migrates centrifugally. (D) unc-53(n152) animal, exhibiting DTC phase 2 path-finding defect. Scale bar: 50 μm.
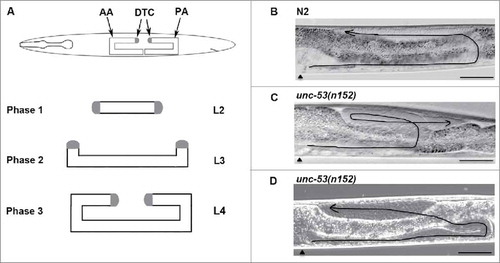
Figure 2. unc-53 Mutation suppresses DTC phase 3 AP polarity defects of ced-10 and mig-2. (A) L4 stage mutant animals were assessed for DTC migration defects using DIC microcopy as described in Materials and Methods. The bars represent percentage of animals with misshaped gonad arms. p values for single mutations are given on the outside end of the bars and were calculated by comparing with N2. p values for double mutants were calculated by pairwise comparison with single mutations. (B) Representative DIC micrograph of ced-10(n1993) L4 stage animals with anterior and midbody () on the left, dorsal side up, displaying DTC phase 3 AP polarity reversal defect in the posterior arm. Scale bar: 50 μm. (C) The graph shows the percentage of animals exhibiting DTC phase 3 AP polarity reversal defects. Statistical analysis used TTEST. *p < 0.05, **p < 0.005, and ***p < 0.0005.
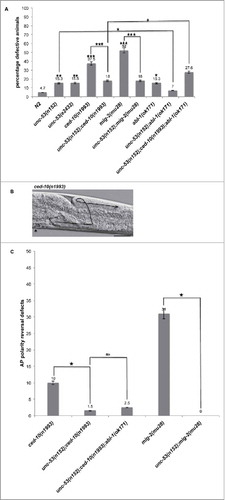
Figure 3. (A) Representative DIC micrograph of unc-5(e53) L4 stage animals with anterior and midbody () on the left, displaying DTC phase 2 DV defect. Scale bar: 50 μm. (B) L4 stage animals were assessed for DTC migration defects using DIC microcopy as described in Materials and Methods. The bars represent percentage of animals with misshaped gonad arms. (C) The graph shows the percentage of animals exhibiting DTC phase 2 DV defects. Statistical analysis used TTEST. *p < 0.05, **p < 0.005, and ***p < 0.0005.
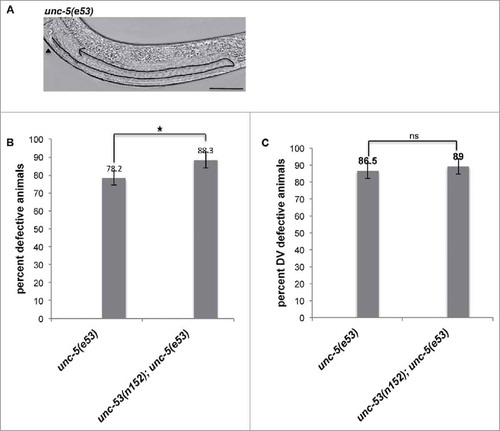
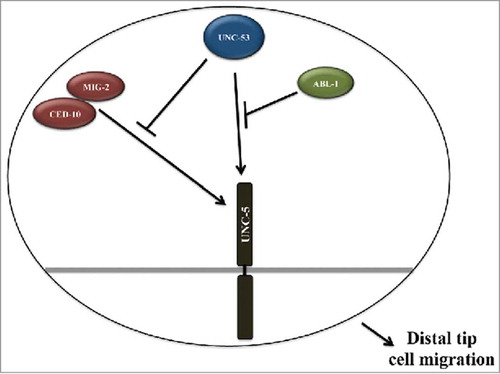
Figure 4. Molecular model depicting UNC-53 mediated regulation of UNC-5 in Rac GTPase dependent and independent pathways required for proper DTC migration: The genetic data supports UNC-53 functioning in Rac GTPase dependent and independent pathways for proper DTC migration by regulating the activity of UNC-5 receptor. We propose that UNC-53 primarily regulate UNC-5 activity by 2 pathways, first by negatively regulating CED-10 and MIG-2 mediated signaling and second pathway includes ABL-1 and most probably ABI-1.