
Figures & data
Figure 1. Protein interaction networks of the altered proteins induced by K+ deficiency. (A): All altered proteins identified from our previous expression proteomics studyCitation11 were analyzed using STRING software. (B): From the entire network, the involved GO biologic functions are highlighted. Each interacting line color represents the interaction evidence, including neighborhood (dark green), gene fusion (red), co-occurrence (dark blue), co-expression (red), experiments (purple), databases (light blue) and text mining (light green). The proteins with arrow represent the identified proteins, whereas upward and downward arrows indicate increase and decrease, respectively, in level of each protein.
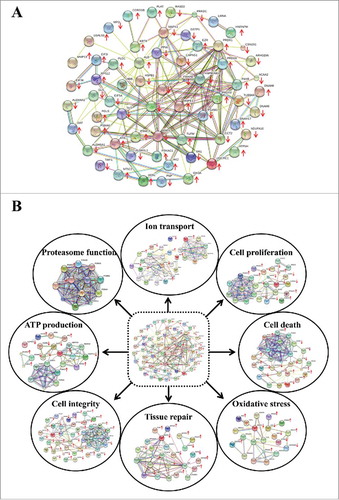
Figure 2. Cell proliferation and cell death. (A): After MDCK cells were maintained in ANK, ALK or AKD medium for 24 h, total number of the cells in each sample was counted. (B) and (C): Cell death was then examined by trypan blue assay and flow cytometry following annexin V/PI co-staining, respectively. Each bar represents mean ± SD of 3 independent experiments. ** = p < 0.01 vs. ANK; # = p < 0.01 vs. ALK.
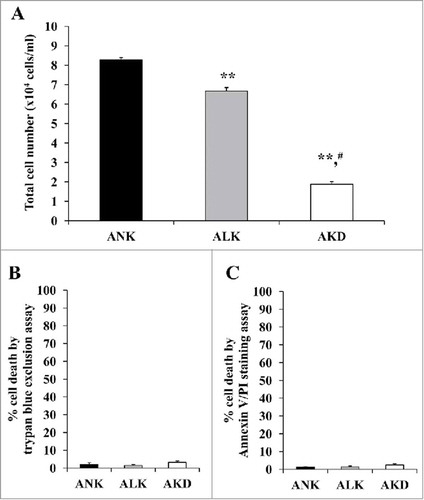
Figure 3. Levels. of oxidatively modified proteins. (A): After MDCK cells were maintained in ANK, ALK or AKD medium for 24 h, OxyBlot assay was used to quantify DNP-derivatized or carbonylated proteins (non-derivatized sample served as a negative control). (B): Band intensity was measured. Each bar represents mean ± SD of 3 independent experiments. ** = p < 0.01 vs. ANK; # = p < 0.01 vs. ALK.
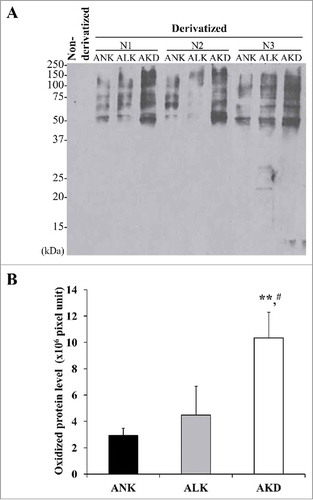
Figure 4. Tissue repair. (A): The cell monolayers were subjected to evaluation of tissue repair activity using scratch assay. Original magnification of 40X in all panels. (B): Percentage of tissue repair was calculated as detailed in “Materials and Methods.” Quantitative data are presented as mean ± SD of 3 independent experiments. * = p < 0.05 vs. ANK; ** = p < 0.01 vs. ANK; # = p < 0.01 vs. ALK. (C): Zoom-in image of the border of the scratched wound to demonstrate protrusion of the cells in ANK and ALK groups to close the wound. Original magnification of 400X in all panels.
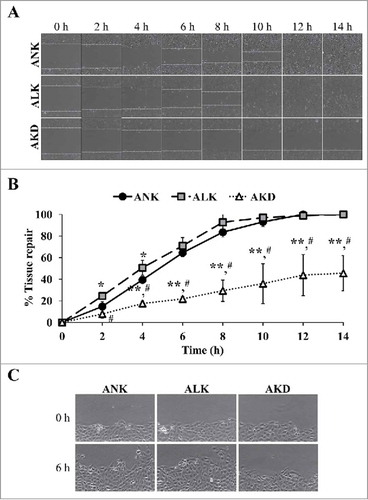
Figure 5. Cell integrity, transepithelial electrical resistance (TER) and expression of tight junction protein. (A): Tight junction barrier function was evaluated by TER measurement. (B): Expression level of ZO-1 was evaluated by Western blotting. (C): Intensity of ZO-1 band was measured and normalized with that of β-actin, which served as the loading control. (D): Expression and localization of ZO-1 was also examined by immunofluorescence staining. Original magnification was 400X in all panels. Each bar in (A) and (C) represents mean ± SD of 3 independent experiments. * = p < 0.05 vs. ANK; ** = p < 0.01 vs. ANK; # = p < 0.01 vs. ALK.
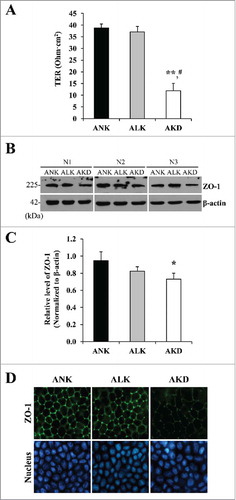
Figure 6. Intracellular ATP. After MDCK cells were maintained in ANK, ALK or AKD medium for 24 h, intracellular ATP was extracted and measured by luciferin-luciferase ATP assay. Total ATP level was subtracted with blank control and then normalized by protein amount in each sample. Each bar represents mean ± SD of 3 independent experiments. ** = p < 0.01 vs. ANK; # = p < 0.01 vs. ALK.
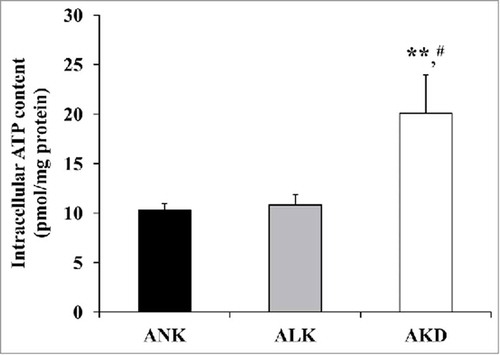
Figure 7. Levels of ubiquitinated proteins. (A): After MDCK cells were maintained in ANK, ALK or AKD medium for 24 h, ubiquitinated proteins were detected by Western blotting. (B): Intensity of ubiquitinated protein bands in each sample was quantitated and normalized with that of ANK. Each bar represents mean ± SD of 3 independent experiments. * = p < 0.05 vs. ANK.
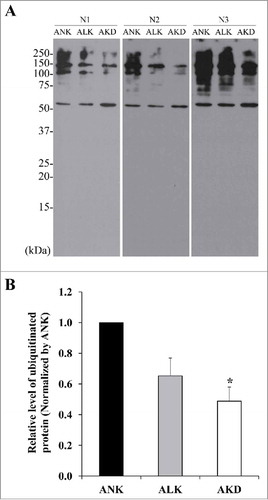
Figure 8. Na+/K+-ATPase expression and cellular K+ uptake. (A): After MDCK cells were maintained in ANK, ALK or AKD medium for 24 h, expression level of Na+/K+-ATPase was evaluated by Western blotting. (B): Intensity of Na+/K+-ATPase band was measured and normalized with that of β-actin, which served as the loading control. (C): Remaining [K+] in culture supernatant was measured after K+ repletion for 1 and 10 min. (D): Percentage of cellular K+ uptake was then calculated. Each bar in (B)-(D) represents mean ± SD of 3 independent experiments. * = p < 0.05 vs. ANK; ** = p < 0.01 vs. ANK; # = p < 0.01 vs. ALK.
![Figure 8. Na+/K+-ATPase expression and cellular K+ uptake. (A): After MDCK cells were maintained in ANK, ALK or AKD medium for 24 h, expression level of Na+/K+-ATPase was evaluated by Western blotting. (B): Intensity of Na+/K+-ATPase band was measured and normalized with that of β-actin, which served as the loading control. (C): Remaining [K+] in culture supernatant was measured after K+ repletion for 1 and 10 min. (D): Percentage of cellular K+ uptake was then calculated. Each bar in (B)-(D) represents mean ± SD of 3 independent experiments. * = p < 0.05 vs. ANK; ** = p < 0.01 vs. ANK; # = p < 0.01 vs. ALK.](/cms/asset/94cf7cec-233b-4b64-9e17-55dc3ce6748e/kcam_a_1356554_f0008_b.jpg)