
Figures & data
Figure 1. Expression of TGFBR3 in TSCC tissues. (A) H&E stain and IHC analysis. (B) TGFBR3 expression in matched normal human tongue tissue and TSCC specimens ( × 400 magnification). (C) Expression of TGFBR3 protein in specimens was evaluated by western blot analysis. (D) Expression of TGFBR3 mRNA in specimens was evaluated by RT-PCR. Glyceraldehyde 3-phosphate dehydrogenase (GAPDH) was used as loading control. These changes were quantitated using densitometry in (C). Data are expressed as the mean ± SEM from three independent experiments (n = 6). *p < 0.05 vs. control.
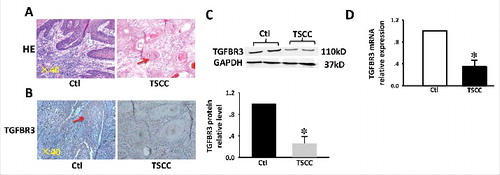
Figure 2. Upregulation of miR-19a and miR-424 in clinical TSCC specimens. (A) miRNA-TGFBR3 interaction network. The hexagon represents the TGFBR3 gene and rounded rectangles represent miRNAs. The red rectangles are the miRNAs that were detected in the expression profile of TSCC in the TCGA; additional miRNAs are colored gray. (B) Heatmap of differentially expressed miRNAs in TSCC and controls. Rows represent miRNAs and columns represent samples. Red represents high expression levels and green represents low expression values. (C) Box-plots of miR-19a and miR-424 expression in TSCC and control samples from the TCGA datasets. (D) Up-regulation of miR-19a and miR-424 in clinical TSCC specimens according to qRT-PCR. Values are shown as the mean ± SEM. n = 6 for each group, *p < 0.05 vs. control.
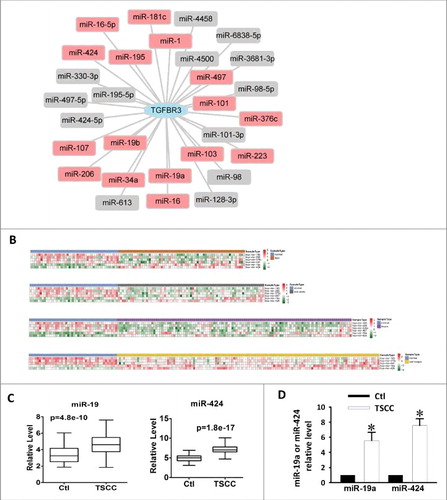
Figure 3. The TGFBR3 gene is a direct target for miR-19a and miR-424. (A) Sequence analysis revealed the two binding sites of miRNA: mRNA complementary between miR-19a, miR-424, and human TGFBR3 gene. (B) Compared with the control, transfection of miR-19a or miR-424 resulted in a significant reduction in TGFBR3 protein expression. Co-transfection of miR-19a with AMO-19a or miR-424 with AMO-424 alleviated the reduction in TGFBR3 protein expression. (C) qRT-PCR analysis revealed that miR-19a and miR-424 markedly inhibited TGFBR3 mRNA expression. (D) Compared with the control, transfection of miR-19a or miR-424 with the luciferase reporter gene linked to the wild-type 3′-UTR of TGFBR3 resulted in a significant reduction in luciferase activity. Co-transfection of miR-19a with AMO-19a or miR-424 with AMO-424 alleviated the reduction in luciferase activity. Three independent experiments (n = 3) were performed for each condition. Data are shown as the mean ± SEM. *p < 0.05 vs. control,# p < 0.05 vs. miR-19a or miR-424 correspondingly. Ctl control, NC transfection of negative control, miR-19a transfection of miR-19a, +AMO-19a co-transfection of miR-19a and its inhibitor (AMO-19a), miR-424 transfection of miR-424, +AMO-424 co-transfection of miR-424 and its inhibitor (AMO-424).
Figure 4. Effect of over-expression of TGFBR3 on migration, EMT and NF-κB activity in CAL-27 cells. CAL-27 cells were transfected for 24 h with 1 µg/ml of plasmid encoding TGFBR3. EV represents empty vector (1 µg/ml of pc-DNA3.1 plasmid)-transfected CAL-27 cells. (A) TGFBR3 expression was determined by western blot analysis and the average band densities from three independent experiments are shown. (B) Scale bars, 10 µm. TGFBR3 overexpression inhibits migration in CAL-27 cells. Following plasmid transfection, cells were subjected to Transwell migration. (C, D) The EMT-related markers, E-cadherin (E-cad) and Vimentin (Vim) were up-regulated and down-regulated after TGFBR3 over-expression for 24 h, respectively. (E) Transient increases in TGFBR3 expression decreased p-p65 expression. (F) Transient increases in TGFBR3 expression resulted in concomitant increases in IκBα expression. (G) TGFBR3 interacts with β-arrestin 2; β-arrestin 2 interacts with IκBα. (J) CAL-27 cells transiently transfected with β-arrestin 2 siRNA. (H) TGFBR3 overexpression decreased p-p65 expression, and co-transfection of TGFBR3 and β-arrestin 2 siRNA resulted in an increase in phosphorylation of p65. Data are presented as mean ± standard deviation following three independent experiments. *p < 0.05 vs. control; # p < 0.05 vs. TGFBR3.
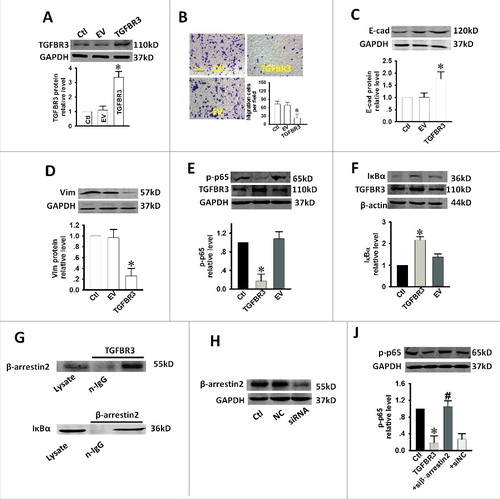
Figure 5. miR-19a and miR-424 promote migration and EMT in CAL-27 cells. (A, B) Scale bars, 10 µm. Enhanced migration in CAL-27 cells by miR-19a or miR-424. N = 5. Down-regulation of E-cad (C, D) and up-regulaiton of Vim (E, F) by miR-19a and miR-424. n = 5. *p < 0.05 vs. control; # p < 0.05 vs. miR-19a or miR-424 alone.
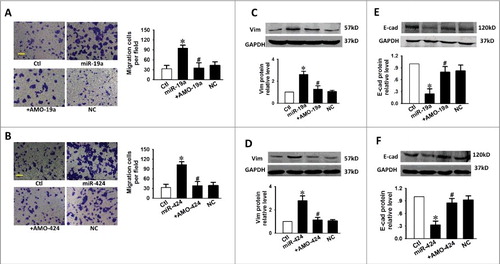
Figure 6. TGFBR3 attenuates the pro-EMT effects caused by miR-19a and miR-424 in cardiac fibroblasts. (A, B) Scale bars, 10 µm. Transwell assay indicates that TGFBR3 abolished miR-19a/miR-24-mediated migration. +TGFBR3: co-transfection of miR-19a or miR-424 and TGFBR3, +EV: co-transfection of miR-19a or miR-424 and empty vector (EV), n = 4. Effects of TGFBR3 on the EMT marker proteins, E-Cad (C, D) and Vim (E, F), following transfection with miR-19a or miR-424. (G, H) TGFBR3 reduces p-p65 expression induced by miR-19a or miR-424. n = 4, *p < 0.05 vs. control; # p < 0.05 vs. miR-19a or miR-424 alone.
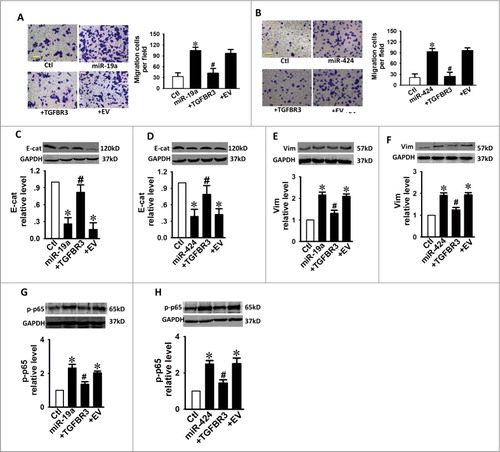
Figure 7. A diagram of miR-19a- and miR-424-mediated down-regulation of TGFBR3 expression. Down-regulation of TGFBR3 resulted in the promotion of migration, and EMT in tongue squamous cell carcinoma cells. TGFBR3 is a direct target for miR-19a and miR-424. β-arrestin 2 facilitates the interaction between TGFBR3 and IκBα and is required for TGFBR3-mediated inhibition of p-p65, EMT and migration in CAL-27 cells.
Table 1. Clinicopathologic Features of TSCC Samples.