Figures & data
Figure 1. Calpain2 is recruited to endosomes in a Rab5 dependent manner. (A) Intracellular localization of calpain2 and the early endosomal network was assessed by three-dimensional reconstruction of confocal z-stacks in A549 lung cancer cells expressing GFP-Calpain2 (green) and stained for endogenous EEA1 with a polyclonal antibody (red). Calpain2-positive endosomes are indicated by arrows and magnifications are shown in the right panels. Bar represents 10 µm. (B, C) Immunoprecipitation of early endosome proteins EEA1 (B) and Rab5 (C). Immunoprecipitations were performed with rabbit polyclonal antibodies and endogenous calpain2 was detected by Western blotting. Whole cell lysates (WCL) are shown as reference. (D) Endosome fractionation and immunoblot detection of calpain2 and the endosomal markers Rab5, Rab7 and EEA1. A549 cells were treated with either control shRNA (sh-ctrl) or a Rab5-specific shRNA (sh-Rab5), as previously described,Citation19 whole cell lysates (WCL) were obtained and endosomes were enriched in discontinuous sucrose gradients, as described in the materials and methods. Fraction 2 contained the interphase between 8 and 30% sucrose (low density, Rab7-positive late endosomes, LE); fraction 4 contained the interphase between 30 and 35% sucrose (high density, EEA1-positive early endosomes, EE). Whole cell lysates (20 µg) are shown as reference. Images are representative from three independent experiments. Relative amount of calpain2 (E) and EEA1 (F) at the early endosome-enriched fraction was assessed by scanning densitometry of immunoblots and normalized to total calpain2 and EEA1 in the whole cell lysates, respectively. Data represent the average of three independent experiments (mean ± s.e.m.; *p < 0.05, **p < 0.01.
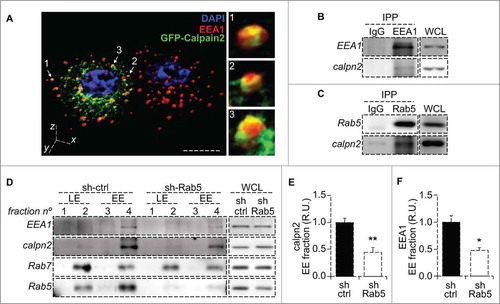
Figure 2. Rab5 is required for calpain2 activation. (A) Calpain2 activity in fixed cells. A549 cells treated with control shRNA (sh-ctrl) or a Rab5-specific shRNA (sh-Rab5) were grown on glass coverslips, serum-starved for 30 minutes and incubated with the calpain2 substrate tBOC-LM-CMAC for 0, 5, 10 or 15 min, and then fixed and mounted. Mean fluorescence intensity was measured in background-subtracted images. (B, C) Data obtained in (A) were analyzed by linear correlation (B), and the slopes corresponding to the velocity of substrate cleavage were calculated (C). Data represent the average of three independent experiments (mean ± s.e.m.; *p < 0.05). (D) Calpain2 activity in live cells. Fluorescence intensity of the cleaved substrate tBOC-LM-CMAC was evaluated in time-lapse experiments, by incubating A549 cells grown on glass-bottom dishes with the substrate and recorded directly in an epifluorescence microscope. Representative images obtained at 0 and 15 min time-frames are shown. (E, F) Data described in (D) were quantified and plotted as the background-subtracted intensities of fluorescence (E) (***p < 0.001; two-way ANOVA), while the slopes obtained at the initial time points corresponded to the velocity of substrate cleavage (F). Data represent the average of three independent experiments (mean ± s.e.m.; *p < 0.05). (G, H) Intracellular Ca2+ response. Intracellular Ca2+ levels were evaluated in time-lapse experiments, by incubating A549 cells grown in glass-bottom dishes with the cytosolic Ca2+ probe Fluo-4AM (5 μM). Ca2+ signal was recorded directly under an epifluorescence microscope. 30 seconds of baseline were recorded and then cells were stimulated with FBS 10% for 2 minutes. Relative fluorescence (Fluorescence difference between stimulated cells and baseline (F-F0) to baseline value (F0)) was calculated as a function of time. The time to reach the peak of Ca2+ signal (i.e. the time to reach the maximal response ((F-F0)/F0)) and the time of activation (i.e. the lapsed time for Ca2+ signal to increase from 10% to 90% of the maximal responseCitation28) were determined from three independent experiments (n.s. non significant).
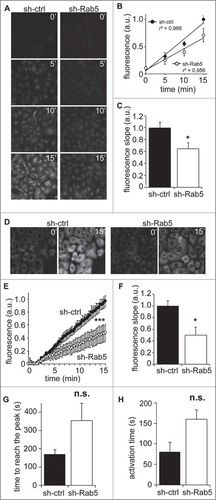
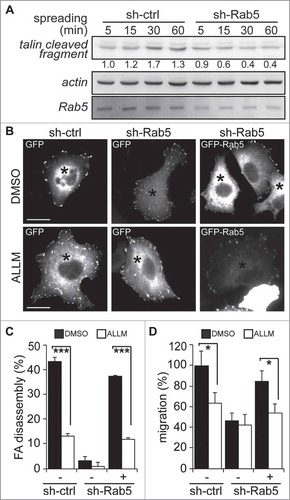
Figure 3. Rab5-mediated focal adhesion disassembly and cell migration require calpain2. (A) A549 cells treated with either shRNA-control (sh-ctrl) or shRNA-Rab5 (sh-Rab5) were allowed to attach and spread on fibronectin-coated plates (2 µg/mL) and whole cell lysates were analyzed by Western blotting of talin cleaved fragment (47 kDa), Rab5 and actin. Representative images are shown and numbers below the panel correspond to the quantification of talin signals by scanning densitometry. Data were normalized to actin (loading control) and shown as the mean of three independent experiments. (B) A549 cells treated with shRNA-control or shRNA-Rab5 were transfected with either GFP (−) or GFP-Rab5 (+), grown on glass coverslips and serum starved overnight. Focal adhesions were synchronized by treatment with 10 µM nocodazole, and focal adhesion disassembly was assessed upon 15 min of nocodazole washout in the presence of either control vehicle (DMSO) or the calpain inhibitor ALLM (50 μM). Focal adhesions were visualized by vinculin staining and representative images obtained after nocodazole washout are shown. Asterisks indicate GFP-positive cells (whole composite images are provided as Supplementary Figure 2). Bar represents 10µm. (C) Focal adhesion disassembly was quantified as the difference between the total number of synchronized focal adhesions per cell (time point 0) and residual focal adhesion number after nocodazole washout. Representative images (B) and data (C) were obtain from three independent experiments (mean ± s.e.m.; ***p<0.001). Note that at least 100 cells were analyzed per condition. (D) A549 cells treated with shRNA-control (sh-ctrl) or shRNA-Rab5 (sh-Rab5) were transfected with either GFP (−) or GFP-Rab5 (+) and allowed to migrate for 120 min in Transwell chambers coated with 2 μg/mL fibronectin in the presence of either control vehicle (DMSO) or the calpain inhibitor ALLM (50 μM). Cells that migrated were visualized by crystal violet staining. Data represent the average from three independent experiments (mean ± s.e.m; *p < 0.05).