Figures & data
Figure 1. Cytotoxic activity and modulation of the cytoskeleton by Amblyomin-X. (A) All cells types were incubated with Amblyomin-X at the indicated concentrations or PMA (200 nM) and bortezomib (100 nM) for 48 h, and cell viability was assessed as described in Materials and Methods. Positive controls staurosporine (5 μM) and MG-132 (3 μM) were evaluated during the same period of treatment. (B) Representative images of F-actin cytoskeleton of HUVEC, SK-MEL-28 and MIA PaCa-2. After 24 h of treatment with Amblyomin-X (20 μM), PMA (200 nM) or bortezomib (100 nM), cells were fixed and stained. Red represents F-actin labeling with phalloidin and blue represents the nucleus stained with DAPI. Image visualized in 100x, bar 20 μm. Values are mean± SD of three independent experiments. *p ≤ 0,05; **p ≤ 0,01 e *** p ≤ 0,001.
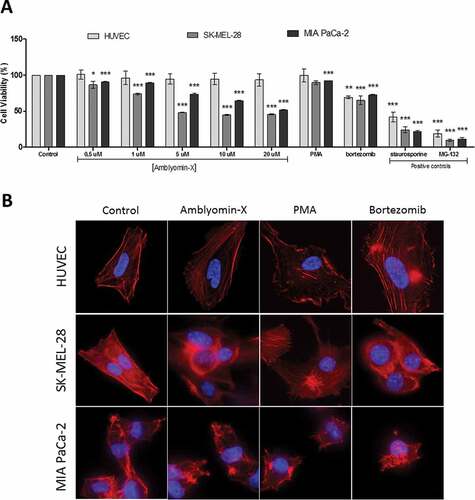
Figure 2. Modulation of cellular migration by Amblyomin-X. Cell migration assays were performed in time lapse (In Cell Analyzer 2200) during 24 hours of treatment with 20 μM Amblyomin-X. The arrows highlight cell extensions and circles emphasize the change in cell morphology. Movies are available in the supplementary material.
Figure 3. Interference of uPAR blockade in Amblyomin-X activity. All cell types were treated with anti-uPAR 1:50 (30 min), followed by treatment with 20 μM Amblyomin-X. (A) Cell viability measured by MTT (48 h of treatment). (B) Representative image of F-actin cytoskeleton of HUVEC, SK-MEL-28 and MIA PaCa-2 (24 h of treatment). Red represents F-actin stained with phalloidin and blue represents the nucleus stained with DAPI. Bar 20 μm. Values are mean± SD of three independent experiments. *p ≤ 0,05; **p ≤ 0,01 e *** p ≤ 0,001. Significance was compared among treated and control (untreated cells) or between the couple of treatments (not shown).
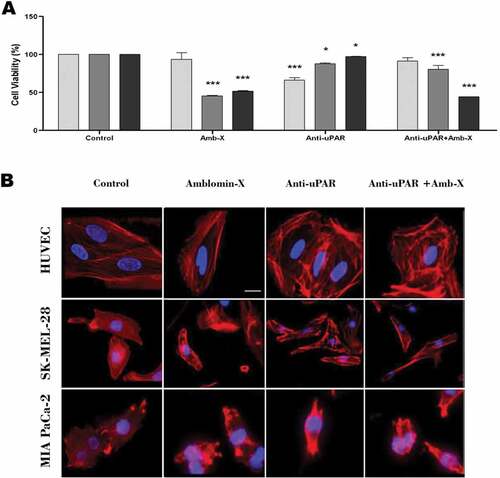
Figure 4. Analysis of Amblyomin-X activity in the migration of cells subjected to uPAR blockade. Cells were incubated with anti-uPAR 1:50 (30 min), followed add of Amblyomin-X (20 μM). The arrows highlight cell extensions and circles emphasize the change in cell morphology. Movies are available in the supplementary material.
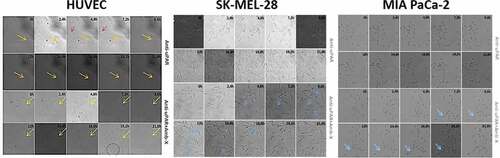
Figure 5. Reduction Rho GTPases protein levels by Amblyomin-X. Cells were treated with anti-uPAR 1:50 (30 min), followed by incubation with 20 μM Amblyomin-X (24 h). Treatments with 200 nM PMA or 100 nM bortezomib for 24 h were used as comparative. After the treatment period, cells were lysed with RIPA buffer and 30 µg of total protein was used for the assays. Western blot of the samples obtained were performed using anti-uPAR, anti-RhoA, anti-Rac-1 and anti-GAPDH antibodies as endogenous control (see experimental procedures). Densitometry analysis of protein bands (numbers below the figures) were evaluate using ImageJ analysis program and values are mean± SD of three independent experiments. Significance was compared among the treated and control (untreated cells) or between the couple of treatments (not shown). uPar Ab+: co-treament with Amblyomin-X.
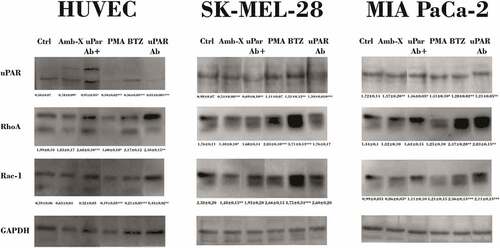
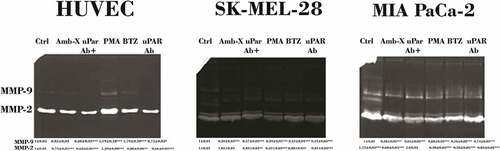
Figure 6. Modulation of MMPs release by Amblyomin-X. All cell types were preincubated 30 min with anti-uPAR (1:50), followed by incubation with Amblyomin- X (20 μM) for 24 h at 37°C. PMA (200 nM) and bortezomib (100 nM) for 24 h were also evaluated . After the treatment period, the cell supernatants collected were submitted to the zymography test as discussed in experimental procedures. Densitometry analysis of protein bands (numbers below the figures) were evaluate using ImageJ analysis program and values are mean± SD of three independent experiments. Significance was compared among treated and control (untreated cells) or between the couple of treatments (not shown).