Figures & data
Table 1. qPCR primers.
Figure 1. Exogenous TGF-β is required for cellular confluence to impact cytosolic TGF-β. Concentrations for cytosolic TGF-β for each cell line are derived from 1 × 10⁶ cells by ELISA. As exogenous TGF-β is added and confluence is reduced, the cytosolic concentration of TGF-β rises, until it saturates at a concentration of ~25 pg/mL for SW480 cells (A) and ~9 pg/mL for MCF7 cells (B). Using α = 0.05, it was found that the individual effects of confluence (p < 0.0001) and exogenous TGF-β (p < 0.0001), as well as the interaction between the two factors (SW480, p = 0.0001; MCF7, p < 0.0001), significantly influenced the concentration of cytosolic TGF-β in both SW480 and MCF7 cell lines. Mean ± standard error of the mean (SEM) is represented.
Figure 2. Changing confluence and TGF-β alters downstream gene expression. The expression of downstream targets of TGF-β, E-cadherin and Slug, were measured by qPCR. For both cell lines, the log relative expression is shown of cells under different conditions when compared to the 100% confluent +0 ng/mL TGF-β using α = 0.05. In both the SW480 cells (a) and the MCF7 cells (b), when both confluence is reduced and TGF-β is added, we observe a significant reduction in E-cadherin expression (p < 0.0001 for the SW480 cells, p = 0.01 for the MCF7 cells) and a significant increase in Slug expression (p = 0.016 for the SW480 cells, p = 0.002 for the MCF7 cells). These changes are also shown in cells with both a reduction in confluence and the addition of exogenous TGF-β (30% confluent + 9.33 ng/mL TGF-β). For all plots, ** indicates p < 0.01 significance while * indicates p < 0.05 significance. Data presented is Mean + Standard Error Range.
Figure 3. Lower cell-cell contact results in increased mesenchymal cell markers with the addition of TGF-β. SW480 and MCF7 cells were analyzed for epithelial (E-cadherin) or mesenchymal (vimentin) markers by flow cytometry. Cells were gated for staining for only E-cadherin (a), only vimentin (b), both markers (c), and neither marker (d) during flow cytometry experiments. Mean ± standard error of the mean (SEM) is represented. Without the application of exogenous TGF-β, changes in confluence lead to relatively small (although statistically significant) changes in the protein expression in both cell lines. With extracellular TGF-β, changes in confluence strongly affect the stained subpopulations (p < 0.0001). Despite this similarity, the cell staining patterns are very different between cell lines. The SW480 cells display a group of cells that stain for both E-cadherin and vimentin. Meanwhile, both before and after the reduction in confluence and the addition of TGF-β, the MCF7 cell population stains primarily for E-cadherin only.
Figure 4. The neighbor number for 30% confluent cells at a threshold of the average nuclei distance +1 standard deviation are shown for SW480 (a) and MCF7 (b) cells, respectively. At this distance, both cell lines skew right with cells having few neighbors. Mean ± standard error of the mean (SEM) is represented.
Figure 5. The percentage of SW480 cells that stained for E-cadherin only (a), vimentin only (b), both markers (c), and neither marker (d) in cell populations that are 30% confluent during immunocytochemistry are shown. The distance threshold is the average neighbor distance +1 standard deviation for each cell line is shown. Like the flow cytometry results, the existence of a dual-staining population of SW480 cells is apparent while the MCF7 cells lack this subpopulation. Further, at all three levels of cellular contact, both with and without exogenous TGF-β, the MCF7 cells exhibit a high amount of staining for E-cadherin only.
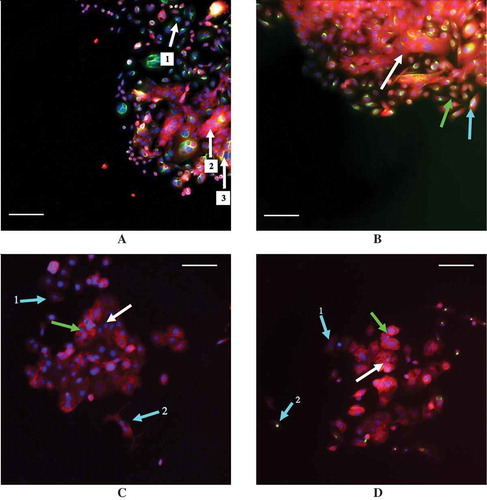
Figure 6. Examples of staining in the MCF7 and SW480 cell lines with E-cadherin staining in red and vimentin staining in green. (a) 30% confluent SW40 cells with 0 ng/mL TGF-β while (b) is 30% confluent SW480 cells with 9.33 ng/mL TGF-β. (c) 30% confluent MCF7 cells with 0 ng/mL TGF-β while (d) is 30% confluent MCF7 cells with 9.33 ng/mL TGF-β. Arrows are color coordinated: blue arrows indicate a cell with a low number of neighbors, green indicates cells with a medium number of neighbors, and white indicates cells with a high number of neighbors, as determined using a threshold distance of the average nuclei distance +1 standard deviation. A scale bar of 100 μm is shown in each image. (a) Arrows 1, 2, and 3 all indicate three different SW480 cells that were classified as having a high number of neighbors that all stained differently: cell 1 has stained solely for vimentin, cell 2 for E-cadherin only, and cell 3 has stained for both vimentin and E-cadherin simultaneously. (b) The SW480 30% confluent +9.33 ng/mL TGF-β treatment group and cells that are classified as having different neighbor numbers all staining dually for E-cadherin and vimentin. (c) The cell at arrow 1 has a low neighbor number and has stained faintly for E-cadherin while the cell at arrow 2 also has a low neighbor number and has stained slightly more for E-cadherin, despite the fact that it is beginning to adopt a spindle-like phenotype. Additionally, E-cadherin is also expressed in the cells at the green arrow and the white arrow, which have a medium number of neighbors and a high number of neighbors, respectively. (d) With the addition of 9.33 ng/mL exogenous TGF-β, MCF7 cells with a medium (green arrow) and high (white arrow) neighbor number are positively stained for E-cadherin. Arrow 1 indicates a cell with a low neighbor number that has not stained for either E-cadherin or vimentin, or possibly faintly stained for E-cadherin, while arrow 2 points to a cell that also has a low neighbor number that has positively stained for vimentin.