Figures & data
Figure 1. Scattergrams of cell tracks of cells migrating on surfaces containing (a) ICAM-1, (b) VCAM-1, or (c) ICAM-1 and VCAM-1. Tracks have been adjusted to all start at the same point. Red tracks indicate cells migrating against the direction of flow and blue tracks indicate cells migrating with the direction of the flow. All images have flow from left to right at 100 s−1. (d) Plot of migration index over time for surfaces coated with recombinant proteins. Upstream migration is indicated by a negative migration index, downstream migration by positive values, and random migration by values near zero. ICAM-1 surfaces support upstream migration while VCAM-1 surfaces do not. Surfaces containing ICAM-1 and VCAM-1 support upstream migration to a similar extent as ICAM-1-only surfaces. Data presented as mean ± SEM, n = 4 independent experiments.
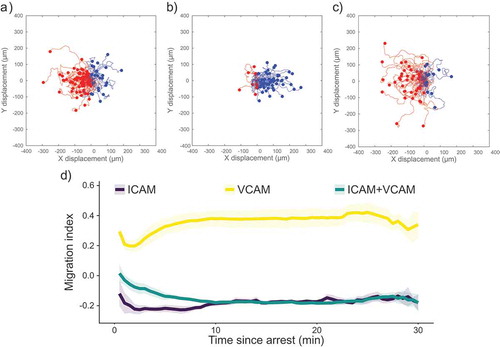
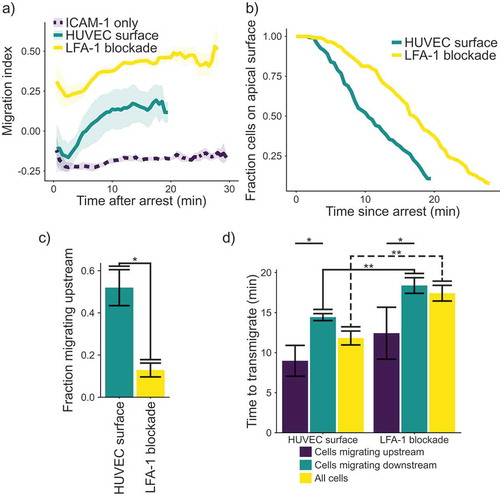
Figure 2. (a) Plot of migration index over time. Upstream migration is indicated by a negative migration index, downstream migration by positive values, and random migration by values near zero. Blockade of LFA-1 prevents upstream migration on TNFα stimulated HUVECS, while cells with unblocked LFA-1 initially migrate upstream before reverting to downstream migration. ICAM-1-only recombinant protein surface data is provided for comparison. Data presented is mean ± SEM, n = 4 independent experiments. (b) Plot showing the remaining fraction of tracked cells at each time point. Cells on HUVEC monolayers were tracked from initial migration to transmigration or the end of the experiment, whichever is sooner. (c) Comparison of fraction of cells which migrated upstream on HUVEC monolayers with or without LFA-1 blockade. Data presented is mean ± SEM, n = 4 independent experiments. (d) Comparison of the time from arrest to transmigration on HUVEC monolayers with or without LFA-1 blockade. Data presented is mean ± SEM, n = 4 independent experiments. * p < 0.05, ** p < 0.005.