Figures & data
Figure 1. Establishment of gradient parallel-plate flow chamber. Schematic diagrams of gradient parallel-plate flow chamber along the cross-sectional view (a) and side view (b). (c) Photo of the base plate of the custom-made gradient parallel-plate flow chamber, wherein the arrow represents the direction of the FSS gradient. (d) FE mesh and wall FSS of gradient parallel-plate flow chamber indicated by the blue box in (c). (e) Numerical simulation results of wall FSS on the bottom surface at the location indicated by the red box in (c). The x-axis is defined along the FSS gradient. (f) Definition of migration parameters. The black dots indicate the centroids of a migrating cell at different times. Si is the distance of cell movement in a given time interval, Sl is the distance of a cell away from its initial position in a given time, and θi is the angle between the flow and migration directions of one cell relative to its initial position.
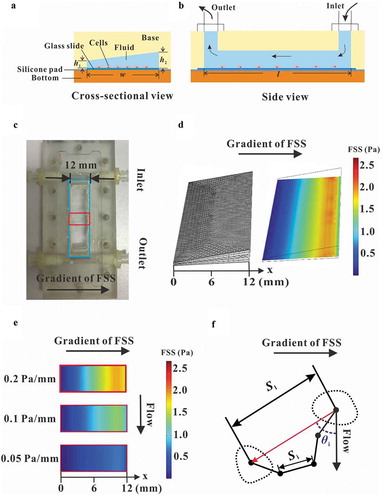
Figure 2. Comparison between the results of PIV measurement and FEA simulation. (a) Traces of fluorescent latex beads recorded at different locations for different gradient FSS fields. (b) Wall FSS in the three FEA models with different FSS gradients, wherein the red arrow represents the direction and magnitude of flow velocity. (c) Statistical analysis of wall FSS at different distances calculated based on the results from PIV measurement and FEA simulation. The regression coefficient for numerical simulation and PIV measurement are 0.9331 and 0.9507 for 0.05 Pa mm−1, 0.9345 and 0.9811 for 0.1 Pa mm−1, and 0.9793 and 0.9667 for 0.2 Pa mm−1, respectively.
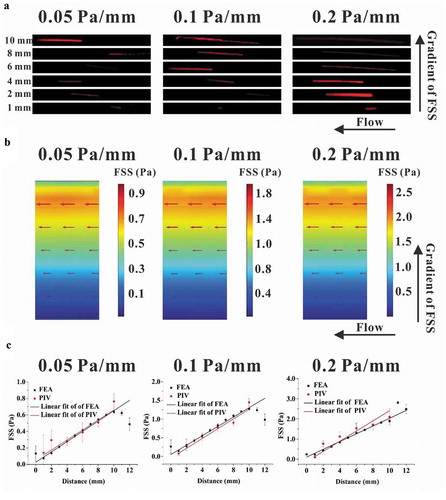
Figure 3. Effect of FSS magnitude on migration of RAW264.7 cells. (a, b, and c) Time-lapsed images of RAW264.7 cells with different magnitudes and gradients of FSS. (d, e, and f) Migration angle θi for three FSS gradients. (g, h, and i) Speed of cell migration along the gradient of FSS for three FSS gradients. (j, k, and l) Speed of cell migration along the flow direction for three FSS gradients. *, p < 0.05.
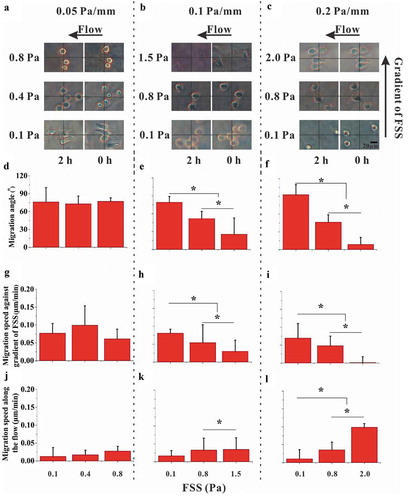
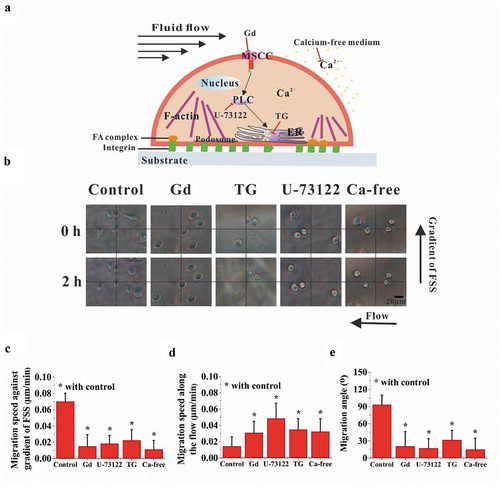
Figure 4. Effect of calcium signaling pathways on cell migration. (a) Schematic diagram of calcium signaling pathway and chemical treatments. (b) Bright-field images of RAW264.7 cells in the locations with large migration angle for 0.1 Pa mm−1 or 0.2 Pa mm−1. The effect of calcium signaling pathways on the migration speed along the FSS gradient (c) and along the flow direction (d). (e) Effect of calcium signaling pathways on the migration angle. *, p < 0.05.