Figures & data
Figure 1. Notch3 overexpression inhibits EMT by the classical Notch signaling pathway in breast cancer cells. (a) Protein expression levels of Notch3 in various human breast cell lines, including MCF-7, T47D, SKBR3, MDA-MB-231Z, MDA-MB-231G, and BT-549, analyzed using western blotting. (b) Effects of Notch3 knockdown or overexpression on expression levels of RBP-jk in MCF-7 or MDA-MB-231 breast cells, respectively, by using western blot analysis. (c) Effects of Notch3 overexpression on expression levels of endogenous full-length Notch3 in MDA-MB-231 breast cells, respectively, by using western blot analysis. (d) Effects of Notch3 knockdown or overexpression on expression levels of endogenous E-ca, E-catenin, and vimentin in MCF-7 or MDA-MB-231 breast cells, respectively, by using western blot analysis. (e) Effects of Notch3 overexpression on expression levels of endogenous E-ca, E-catenin, and vimentin in MDA-MB-231 breast cells by using qRT-PCR. (f) Effects of Notch3 knockdown on expression levels of endogenous E-ca, E-catenin and vimentin in MCF-7 breast cells by using qRT-PCR. (g) MCF-7 or MDA-MB-231 cells were subjected to the transwell assay under knockdown or overexpression of Notch3, respectively, including N3ICD or TD+N3ICD. Cells migrating across the membrane were imaged with a bright-field microscope at ×40 magnification. (h) Quantitative data of Matrigel non-coated transwell assays. MDA-MB-231 cells were transfected with pCLE, pCLE-N3ICD, pCMV or pCMV-(TD+N3ICD). Migrant cells were counted in five random fields. (i) Quantitative data of Matrigel non-coated transwell assays. MCF-7 cells were transfected with siNC or siN3. Migrant cells were counted in whole fields. (j) Wound healing assays were performed with MDA-MB-231 cells with ectopic overexpression of N3ICD or TD+N3ICD. Representative images. (k) Quantitative wound recovery data after 0, 6, 12, 24, 48 and 72 h in cell culture. Data are presented as the mean ± SD of three independent experiments, and asterisks indicate statistical significance (*, p < 0.05; **, p < 0.01; ***, p < 0.001).
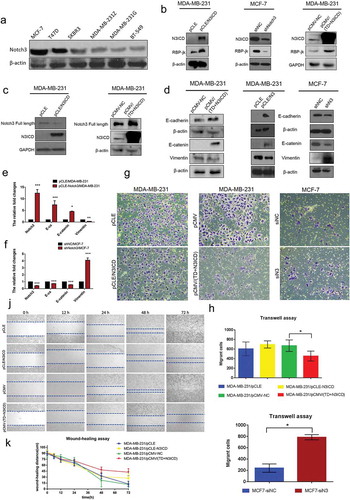
Figure 2. Ectopic overexpression of TD+N3ICD upregulates the expression of tight junctions molecules and promotes their appropriate localization (a) Effects of Notch3 knockdown or overexpression on expression levels of tight junctions molecules in MCF-7 or MDA-MB-231 breast cells, respectively, by using qRT-PCR. (b) Effects of Notch3 knockdown or overexpression on expression levels of tight junctions molecules in MCF-7 or MDA-MB-231 breast cells, respectively, by using western blotting. (c) Double-label immunofluorescence staining of Notch3 (red color) and ZO-1 (green color) and Z-stack analysis in MDA-MB-231/pCMV and MDA-MB-231/pCMV-(TD+ N3ICD) cells, 40 ×. (d) Double-label immunofluorescence staining of Notch3 (red color) and Claudin 7 (green color) in MDA-MB-231/pCMV and MDA-MB-231/pCMV-(TD+ N3ICD) cells, 40 ×. Data are presented as the mean ± SD of three independent experiments, and asterisks indicate statistical significance. (*, p < 0.05; **, p < 0.01; ***, p < 0.001).
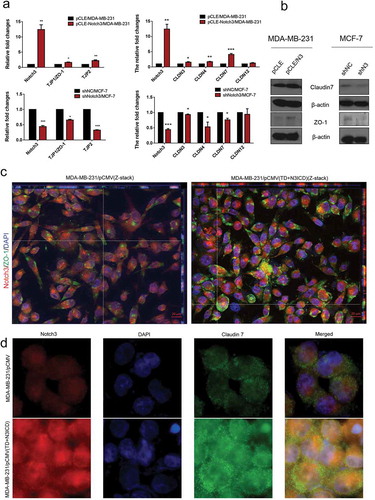
Figure 3. Ectopic overexpression of TD+N3ICD upregulates the expression of adherens junction molecules and promotes their appropriate localization (a) Quantification of positive ZO-1 signals by calculating the positive area combined with the signal intensity. (b) Quantification of positive Claudin 7 signals by calculating the positive area combined with the signal intensity. (c) Double-label immunofluorescence staining of Notch3 (red color) and E-cadherin (green color) and Z-stack analysis in MDA-MB-231/pCMV and MDA-MB-231/pCMV-(TD+ N3ICD) cells, 40 ×. (d) Double-label immunofluorescence staining of Notch3 (red color) and E-catenin (green color) in MDA-MB-231/pCMV and MDA-MB-231/pCMV-(TD+ N3ICD) cells, 100 ×. (e) Quantification of positive E-cadherin signals by calculating the positive area combined with the signal intensity. (f) Quantification of positive E-catenin signals by calculating the positive area combined with the signal intensity. Data are presented as the mean ± SD of three independent experiments, and asterisks indicate statistical significance. (*, p < 0.05; **, p < 0.01; ***, p < 0.001).
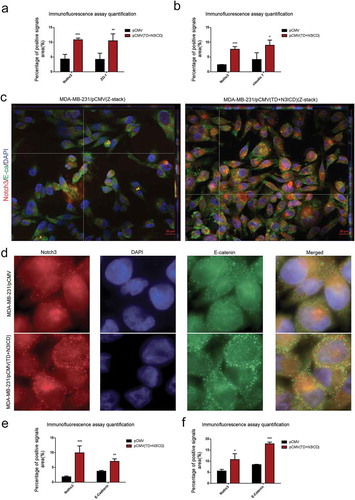
Figure 4. Ectopic overexpression of TD+N3ICD upregulates the expression of PAR-3-aPKC-PAR-6 complex components and promotes their appropriate localization. (a) Effects of Notch3 overexpression on expression levels of PAR-3-aPKC-PAR-6 complex in MDA-MB-231 breast cells by using qRT-PCR. (b) Effects of Notch3 knockdown on expression levels of PAR-3-aPKC-PAR-6 complex in MCF-7 breast cells by using qRT-PCR. (c) Effects of Notch3 knockdown or overexpression on expression levels of PAR-3-aPKC-PAR-6 complex in MCF-7 or MDA-MB-231 breast cells, respectively, by using western blotting. (d) Double-label immunofluorescence staining of Notch3 (red color) and ParD3 (green color) in MDA-MB-231/pCMV and MDA-MB-231/pCMV-(TD+ N3ICD) cells, 40 ×. (e) Double-label immunofluorescence staining of Notch3 (red color) and ParD6 (green color) in MDA-MB-231/pCMV and MDA-MB-231/pCMV-(TD+ N3ICD) cells, 40 ×. (f) Quantification of positive ParD3 signals by calculating the positive area combined with the signal intensity. (g) Quantification of positive ParD6 signals by calculating the positive area combined with the signal intensity. Data are presented as the mean ± SD of three independent experiments, and asterisks indicate statistical significance (*, p < 0.05; **, p < 0.01; ***, p < 0.001).
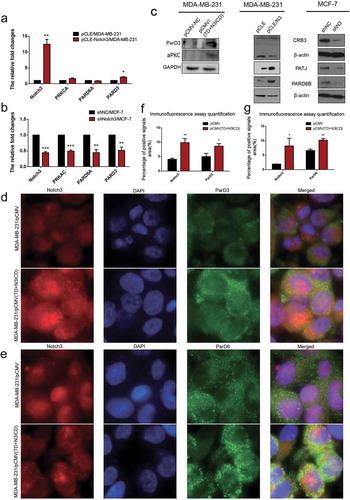
Figure 5. Ectopic overexpression of TD+N3ICD upregulates the expression of cell basal and lateral polarity complex components and promotes their appropriate localization. (a) Effects of Notch3 knockdown or overexpression on expression levels of cell basal and lateral polarity complex components in MCF-7 or MDA-MB-231 breast cells, respectively, by using qRT-PCR. (b) Effects of Notch3 knockdown or overexpression on expression levels of cell basal and lateral polarity complex components in MCF-7 or MDA-MB-231 breast cells, respectively, by using western blotting. (c) Double-label immunofluorescence staining of Notch3 (red color) and LLG2 (green color) in MDA-MB-231/pCMV and MDA-MB-231/pCMV-(TD+ N3ICD) cells, 40 ×. (d) Double-label immunofluorescence staining of Notch3 (red color) and PATJ (green color) in MDA-MB-231/pCMV and MDA-MB-231/pCMV-(TD+ N3ICD) cells, 40 ×. (e) Quantification of positive PATJ signals by calculating the positive area combined with the signal intensity. (f) Quantification of positive LLGL2 signals by calculating the positive area combined with the signal intensity. Data are presented as the mean ± SD of three independent experiments, and asterisks indicate statistical significance (*, p < 0.05; **, p < 0.01; ***, p < 0.001).
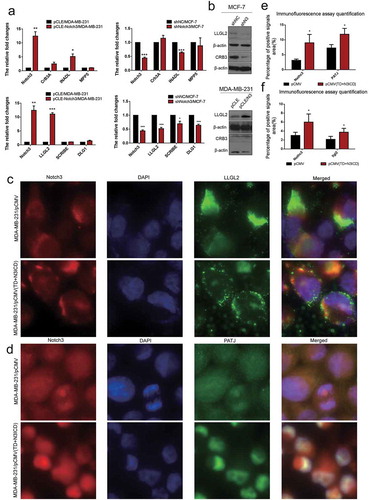
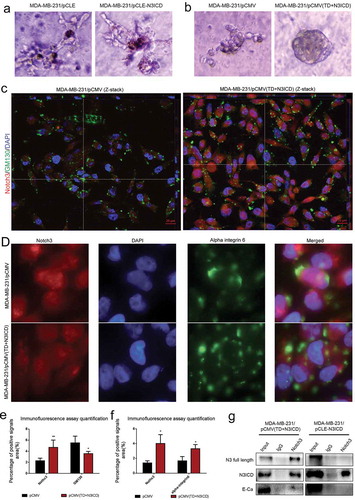
Figure 6. The upregulated endogenous full-length Notch3, which interacts with E-ca, can promote acinar formation and change the distributions of GM130 and alpha-integrin 6 in MDA-MB-231 cells/pCMV-(TD+ N3ICD) cells. (a) Acinar formation assay. The acinar structures of MDA-MB-231 cells transfected with pCLE and pCLE/N3ICD which cultured in Matrigel for 17 days, 10 ×. (b) The acinar structures of MDA-MB-231 cells transfected with pCMV and pCMV/(TD+N3ICD) which cultured in Matrigel for 17 days, 10 ×. (c) Double-label immunofluorescence staining of Notch3 (red color) and GM130 (green color) and Z-stack analysis in MDA-MB-231/pCMV and MDA-MB-231/pCMV-(TD+ N3ICD) cells, 100 ×. (d) Double-label immunofluorescence staining of Notch3 (red color) and alpha-integrin 6 (green color) in MDA-MB-231/pCMV and MDA-MB-231/pCMV-(TD+ N3ICD) cells, 40 ×. (e) Quantification of positive GM130 signals by calculating the positive area combined with the signal intensity. (f) Quantification of positive alpha-integrin 6 signals by calculating the positive area combined with the signal intensity. (g) Co-immunoprecipitation followed by western blotting was performed to detect physical associations between endogenous Notch3 and E-ca. The anti-Notch3 antibody was used to pull down, and the anti-Notch3, E-ca antibodies were used to probe the IP complexes. Input was used as a positive control and IgG was used as a negative control. Data are presented as the mean ± SD of three independent experiments, and asterisks indicate statistical significance (*, p < 0.05; **, p < 0.01; ***, p < 0.001).