Figures & data
Figure 1. The experimental system for the generation and imaging of migratory BMDCs. (a) A scheme depicting the in vitro preparation of WT (CFP) and DKO (CFSE) BMDCs, LPS stimulation, intradermal (i.d.) co-injection, and 2 Pmicroscopy live imaging in popliteal lymph nodes of WT recipients. (b) ICAM-1 and MHC-II expression on BMDCs vs. resident lymph node DCs stimulated with anti-CD40. ICAM-2 was undetectable on BMDCs (not shown). (c) ICAM deficiency does not affect the entry of co-injected LPS stimulated OVA peptide loaded DCs into the T zone of popliteal lymph nodes, determined 24-h post intrafootpad transfer in multiple fields in this zone. Right panel depicts the mean of the values in multiple fields of view determined in eight mice.
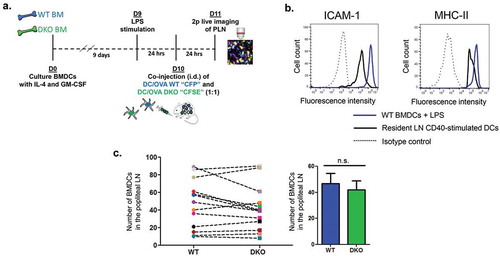
Figure 2. Stable OT-II conjugates with co-transferred LPS stimulated OVA peptide loaded WT and ICAM1/2 DKO DCs imaged at different time points post i.v. transfer of OT-II T cells. (a) A scheme depicting WT and ICAM 1/2 DKO migratory DCs loaded with a saturating dose of OVA peptide introduced intrafootpad 24–27 h prior to live imaging performed either 3–6 h or 14–23-h post i.v. injection of the OT-II T cells. (b) The number of stable conjugates depicted between WT or DKO migratory DCs and OT-II T cells injected either 3–6 h (left) or 14–23 h (right) prior to imaging. Stable conjugates were defined as T-DC pairs observed at the beginning of each imaging period and persisting for at least 20 min thereafter. Conjugates present in the same fields are shown in multiple experiments, each marked with a different symbol color. The number of T-DC conjugates in each field was normalized to identical WT and DKO DC density per field in each experiment. Left panel: ** p < 0.0088; Right panel: *** p < 0.0006. No conjugates were detected between polyclonal CD4 T cells and WT BM-DCs (not shown).
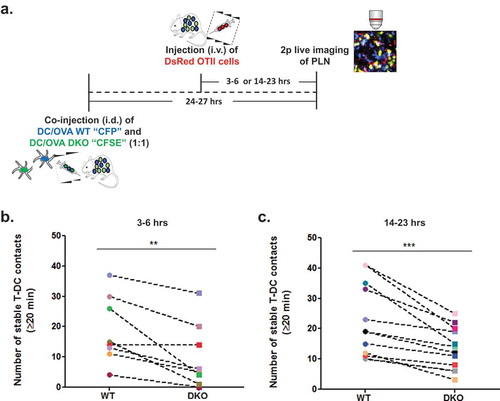
Figure 3. TCR stimulated arrests of OT-II on WT and ICAM KO BMDC inside lymph nodes analyzed by 2P microscopy. (a) A representative image from an intravital microscopy movie showing co-injected naïve DsRed OT-II T cells (white arrows) and non-specific polyclonal (GFP) CD4+ T cells (orange arrow) interacting with migratory WT LPS stimulated BMDCs (CFP) loaded with saturating OVA peptide in intact popliteal lymph nodes. (b) Contact durations of the different T cell subsets interacting with WT migratory DCs, as described in A, analyzed by intravital 2P microscopy (n = 2, representative of four movies). OVA-loaded WT BMDCS were introduced intrafootpad 24–27 h prior to live imaging performed 3–6-h post i.v. injection of the different T cells. (c) Contact durations of DS-Red OT-II CD4+ T cells with co-transferred LPS stimulated CFP WT and CFSE DKO BMDCs loaded with a saturating dose of an OT-II binding OVA peptide. OVA-loaded BMDCs were introduced intrafootpad 24–27 h prior to live imaging performed 3–6-h post i.v. injection of the OT-II T cells. The contact durations were determined by 2P imaging in six fields of view imaged in five mice (in three independent experiments).
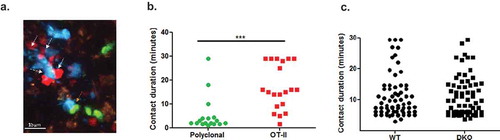
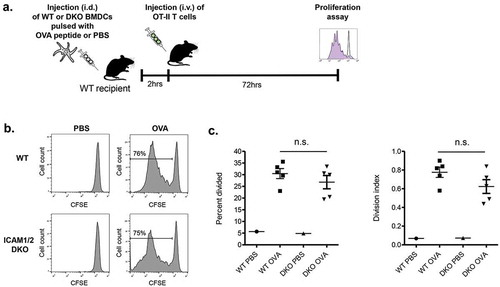
Figure 4. Proliferation of OT-II CD4 T cells inside lymph nodes transferred with LPS stimulated OVA peptide loaded skin migratory BMDCs (a) A scheme depicting the outline of the experiment. (b) Proliferation histograms of CFSE labeled OT-II CD4 T cells transferred 2 h after intrafootpad injection of WT BMDCs or DKO BMDCs each loaded with a saturating dose of OVA peptide. CSFE levels were determined 72 h after T cell injection. (c) The percentage of the OT-II CD4 T lymphocytes shown in (B) that divided at least once and their division index. n = 3. ns, nonsignificant by two-tailed test.