Figures & data
Figure 1. Extracellular AGR2 increases the chemotaxis of NIH3T3 cells through FGFR and VEGFR under saDMEM. (a) Schematic diagram showing generation and simulation of the AGR2 concentration gradient. (b) Western blot results showing AGR2 concentration gradient development compared with a western blot of (c) standard AGR2 concentration. (d) The plot of relative AGR2 concentration calculated from band intensity using Image studio software. (e) Time-lapsed images of NIH3T3 cells migrating along the concentration gradient of AGR2 in G1 under saDMEM semisolid medium, Images were taken using phase contrast microscopy at x100 magnification. Scale bar: 100 µm. (f) & (g) Trajectories of NIH3T3 cells migration along a concentration gradient of AGR2, AGR2-FGFRI, and AGR2-VEGFRI, bFGF, AGR2-bFGF. AGR2: anterior gradient 2; bFGF: basic fibroblast growth factor 2; FGFRI: fibroblast growth factor receptor inhibitor; VEGFRI: vascular endothelial growth factor receptor inhibitor.
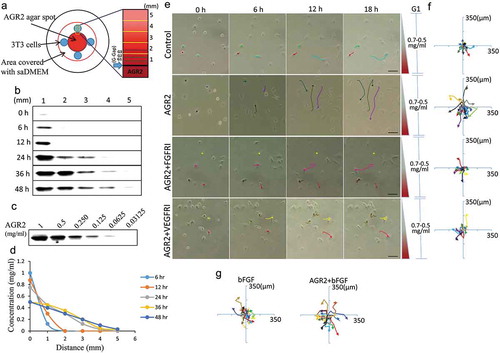
Figure 2. Extracellular AGR2 coupled with bFGF increases the migration of 3T3 cells. (a) Migration of NIH3T3 cells along the concentration gradient after 18 h calculated from the trajectory data (n = 80). (b) Total Migration of NIH3T3 cells tracked at 6 h interval and analysed the mobility of cells (n = 80). (c) Migration speed of NIH3T3 cells calculated by tracking an individual cell from 0–6 h, 6–12 h, and 12–18 h (n = 80). Asterisks indicate a significant difference in cell migration. (*p < 0.01, **p < 0.001, ***p < 0.0001).
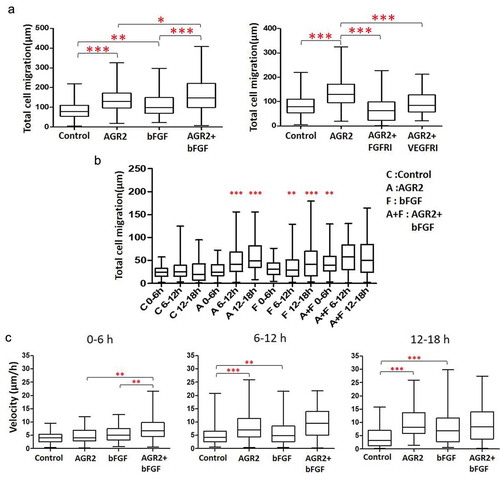
Figure 3. Effect of AGR2 on NIH3T3 cell migration is concentration dependent. (a) Individual cells migration after 6 h, 12h and 18 h in G1, G2, and G3 are plotted for each condition tested (n = 25). (b) The chemotaxis for average cells in G1, G2 and G3 after 6 h, 12h, and 18 h are plotted for each condition tested (n = 25). Asterisks indicate a significant difference in cell migration. (*p < 0.01, **p < 0.001, ***p < 0.0001). C: Control; A: AGR2; F: bFGF; A + F: AGR2-bFGF.
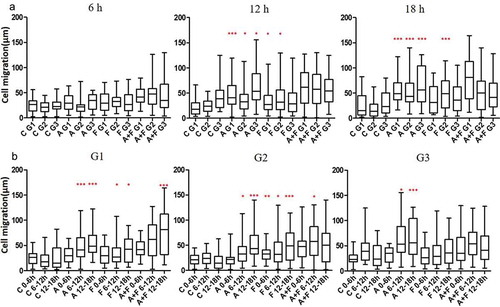
Figure 4. Secretory AGR2 helps to organize fibroblasts by promoting cell elongation and proliferation. (a) Effect of CM collected after 5 days from MCF7, H460, SKOV3 cultures on the growth of 3T3 cells, observed after 24 h using phase contrast microscopy at x100 magnification. (b) The proliferation of NIH3T3 cells plotted after 24 h by counting cells using haemocytometer. (c) The expression of AGR2 analysed from MCF7, H460 and SKOV3 cell lysate and conditioned medium by western blot and immunoprecipitation as indicated. 50 ml conditioned medium of each culture was used for immunoprecipitation. (d) Effect of rAGR2, bFGF, and rAGR2-bFGF on the growth of 3T3 observed using phase contrast microscopy at x100 magnification. The concentration of rAGR2 is 500 ng/ml. The concentration of bFGF is 1 ng/ml. (e) The proliferation of 3T3 plotted after 24 h by counting cells using haemocytometer. Each column represents mean±SD (n = 5). (f) Cells were seeded and treated with MCF7 CM, 18A4 mAb and MCF7 CM/AGR2¯ and typical morphology were obtained by phase contrast microscopy. Scale bar: 100 µm (g) Ratio (length/width) was obtained using Image-Pro Plus software by using 80 isolated cells for each condition. Asterisks indicate the significant difference of cells proliferation and elongation. (**p < 0.001, ***p < 0.0001).
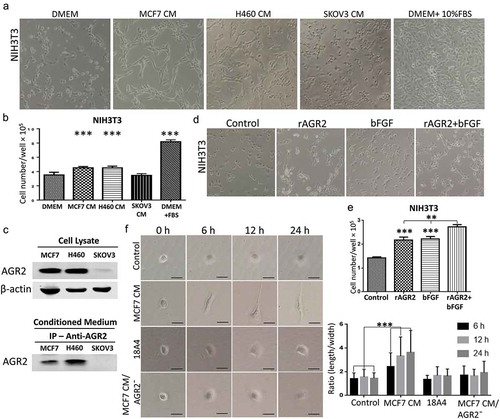
Figure 5. Extracellular AGR2 enhances RhoA, CDC42 expression and stimulates FAK phosphorylation in NIH3T3 cells. (a) Western blot analysis of RhoA expression in NIH3T3 cells stimulated for 24 h with AGR2 coupled with or without bFGF. The concentration of AGR2 is 500 ng/ml. The concentration of bFGF is 1 ng/ml. (b) NIH3T3 cells were treated by 500 ng/ml AGR2 for the indicated time. RhoA, cyclin D1, P21, ERK1/2, pERK1/2, CDC42, Rac1, RhoB, and RhoC were detected by western blots. β-actin served as loading control. (c) Significant reduction in RhoA expression, cyclin D1 expression, and FAK phosphorylation was observed in the NIH3T3 cells pretreated with 20 nM/ml FGFR1 inhibitor PD173074 and 10 nM/ml VEGFR inhibitor axitinib before AGR2 treatment. β-actin served as loading control.
Figure 6. Secretory AGR2 enhances RhoA expression and induces NIH3T3 cells elongation. (a) NIH3T3 cells were treated with AGR2 (500ng/ml), MCF7CM, MCF7 CM/AGR2̅, H460 CM and H460 CM/AGR2 ̅ for 24 h and immunostained for RhoA and F-actin. Scale bar: 25 µm. Bottom row showing enlarge area indicated in merge image panel.
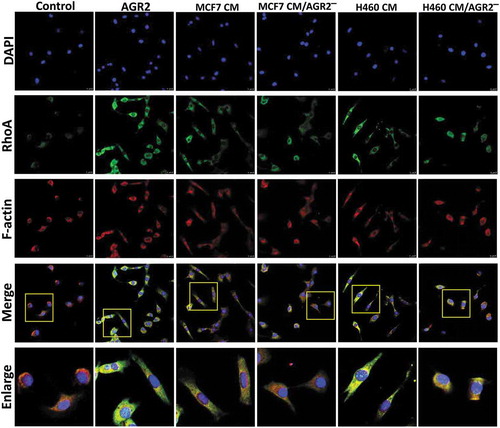
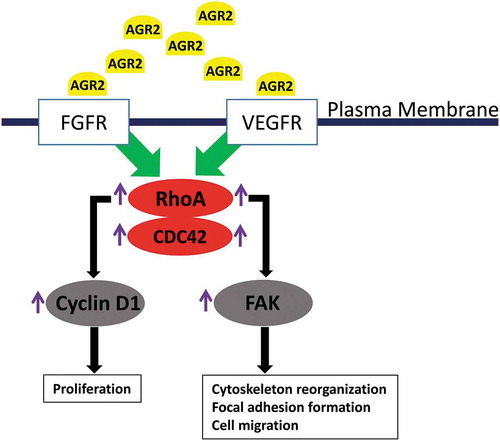
Figure 7. Hypothetic model of paracrine signalling of AGR2 in fibroblasts. In the initial signal, extracellular AGR2 could stimulate RhoA expression through FGFR and VEGFR. As a signalling cascade, increased RhoA expression upregulated G1-S phase cell cycle molecule cyclin D1 for proliferation mechanism. Another mechanism of AGR2 through RhoA expression could phosphorylate FAK for cytoskeleton reorganization and focal adhesion formation to promote cell migration.