
Figures & data
Figure 1. The effect of NAT1 deletion on cell adhesion. (a) Adherence of MDA-MB-231, HT-29 and HeLa cells was quantified in a xCELLigence RTCA DP analyser by increased impedance as cell adhered to each well (cell index). Parental cells (●); KO cells (〇). (b) Removal of cells from plastic culture plate with 0.05% trypsin. Data are presented as mean ± sem, n = 4. Asterisk indicates p < 0.05 by two-way ANOVA
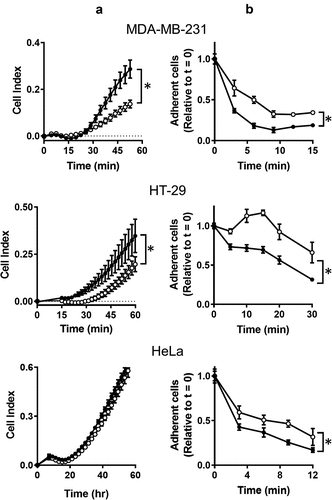
Figure 2. Changes in cell morphology following NAT1 deletion. (a) Confocal images of MDA-MB-231 parent (p), NAT1 knock out (KO) and NAT1 rescue (r) cells cultured on collagen for 20 hr, fixed and stained with phalloidin. Quantification of aspect ratio (b) and cell size (c) for each of the cell lines using ImageJ. Results are shown as mean with 10–90% range, n > 60. Asterisks p < 0.05 by one way ANOVA with Tukey’s multiple comparisons test
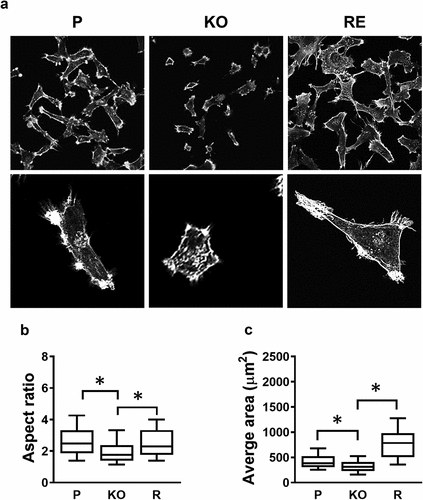
Figure 3. Effect of NAT1 deletion on migration in MDA-MB-231 cells. (a) Real-time measurement of MDA-MB-231 parent parental cells (●) and NAT1 KO cells (〇) migration. (b) Wound healing assay was performed in both parental (p) and NAT1 knockout (KO) cells over 20 hr. Migration was quantified and is expressed as mean with 10–90% range, n = 3
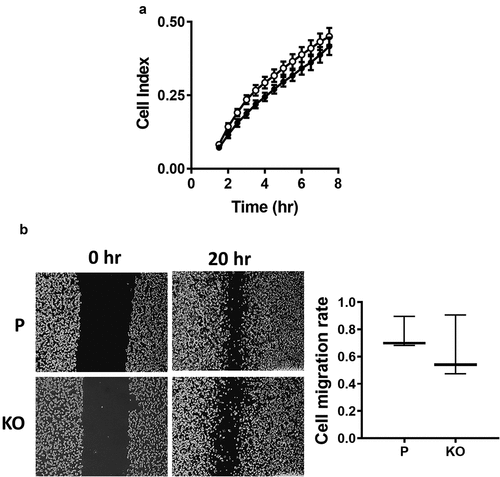
Figure 4. Effect of MMP expression on MDA-MB-231 invasion through matrigel. (a) Real time monitoring of invasion for parental (●), NAT1 KO cells (〇) and NAT1 rescue (●) cells Asterisk indicates p < 0.05 by two-way ANOVA. (b) Expression of MMP1, 3 and 9 in NAT1 parental (p) and knockout (KO) cells in the absence or presence (+Plg) of plasminogen. Western blots are representative of at least 2 independent experiments. (c) Effect of plasminogen on the invasion of parental ● – plasminogen; ● + plasminogen) and NAT1 KO cells (〇 – plasminogen; 〇+ plasminogen). Asterisk indicates p < 0.05 by two-way ANOVA. (d) Effect of MMP pan inhibitor GM6001on the invasion of parental (● – GM6001; ● + GM6001) and NAT1 KO cells (〇 – GM6001; 〇+ GM6001). Results are shown as mean ± sem, n = 4
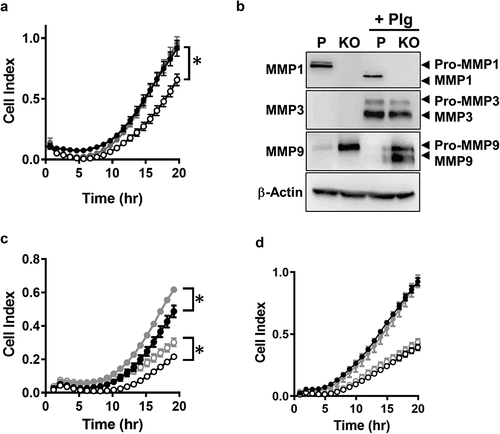
Figure 5. Role of integrins in MDA-MB-231 invasion (a) Integrin expression in parental (black bar), NAT1 knockout (open bar) and rescue (grey bar) cells. Results are shown as mean ± sem, n = 3. Asterisks p < 0.05 by one way ANOVA with Tukey’s multiple comparisons test. (b) Quantification of ITGαV surface expression in parental (P), NAT1 knockout (KO) and NAT1 rescue (R) cells lines. Results are shown as mean with 10–90% range, n = 4. Asterisks p < 0.05 by one way ANOVA with Tukey’s multiple comparisons test. (c) Effect of ITGαV antibody treatment on the invasion of parental cells compared to NAT1 KO cells. Parental (●), NAT1 KO cells (〇) and parental plus ITGαV antibody (♦). Results are shown as mean ± sem, n = 4. Asterisk indicates p < 0.05 by two-way ANOVA
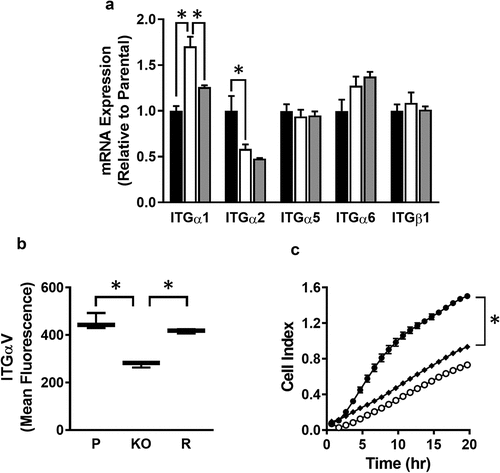
Table 1. Primers used for qPCR experiments