
Figures & data
Figure 1. Morphological and quantitative analysis of NIH-3T3 cells on plane for 24 or 48 h. (a) The merged images consist of F-actin (red) and the DAPI-stained nucleus (blue). The force direction is vertical, and static culture as a negative control. Scale bars: 200 μm. (b) The cell direction converted to a range of 0–90°. (c) Box plot of CSI. (d) Average red fluorescence intensity (F-actin). (e) Mean single cell area. (f) Cell counts. Statistical significance was assessed by two-way classification ANOVA with Bonferroni’s (b-f) post hoc test (n = 9). Mean ± SEM (b, c), Mean ± SD (d-f)
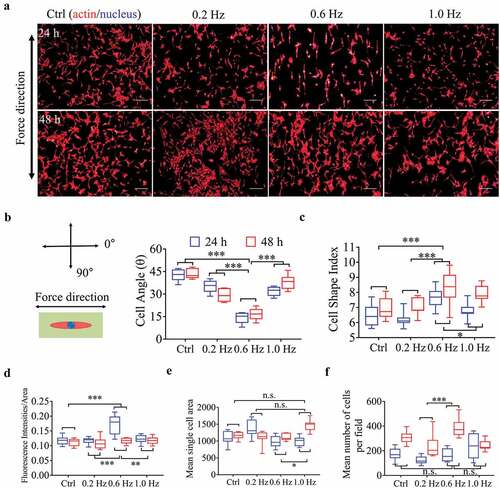
Figure 2. Fluorescence analysis of adhesion and differentiation of NIH-3T3 cells incubated on plane substrates. (a) Images of cell morphology at 24 h under high magnification. Left, Green showing vinculin, Col-I or α-SMA fluorescence. Right, the merged images overlapping of three colors: red (actin), green (vinculin, Col-I or α-SMA) and blue (nucleus). Scale bars = 20 μm. (b) Focal adhesion area per focal contact point. (c) Focal adhesion number per cell. (d) Mean focal adhesion area per cell. (e) Mean vinculin fluorescence intensity. (f) Mean Col-I fluorescence intensity. (g) Mean α-SMA fluorescence intensity. Statistical analyses: two-way classification ANOVA with Bonferroni’s (b-g) post hoc test (n ≥ 5, cell counts>20). Mean ± SD (b-g). n.s., no statistical significance; *, P < 0.05; **, P < 0.01; ***, P < 0.001
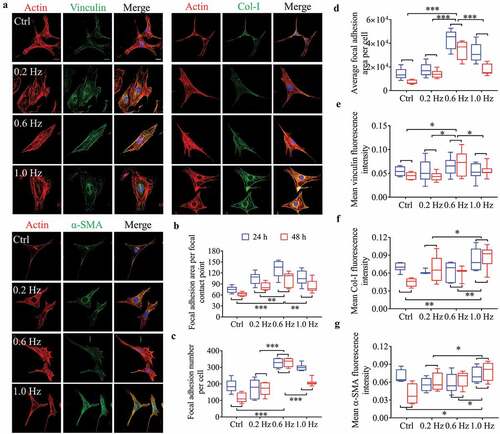
Figure 3. The morphology and quantification of NIH-3T3 cells implanted on groove structures for 24 h and 48 h. (a) The merged images consist of F-actin (red) and the DAPI-stained nucleus (blue). The force direction is vertical, with the static culture as a control. Scale bars: 200 μm. (b) SEM micrographs of fibroblasts at 24 h and 48 h on groove substrates. (c) Cell angle at 24 h. (d) Mean single cell area at 24 h. (e) Cell shape index at 24 h. (f) Ratio of cells on the ridge to groove. (g) Mean F-actin fluorescence intensity of cells seeded on grooves. Statistical analyses: two-way classification ANOVA with Tukey’s (c-g) post hoc test (n = 9, cell counts>600). Mean ± SEM (c-d), Mean ± SD (e-g). n.s., no statistical significance; *, P < 0.05; **, P < 0.01; ***, P < 0.001
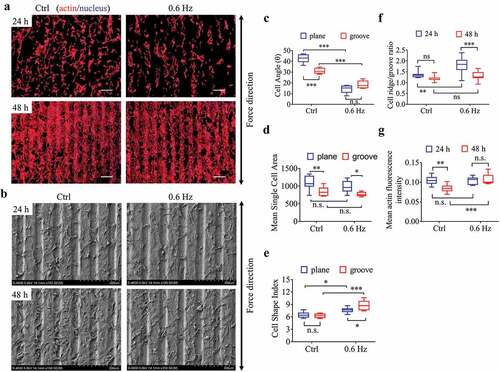
Figure 4. The migration of NIH-3T3 cells seeded on plane/groove substrates for 24 h. (a) The schematic diagram shows the relative position between scratch and groove orientation. a, scratch perpendicular to the groove direction; b, scratch along the groove direction; c, scratch on the plane after the cells are covered. (b) Images of cell migration under low magnification (5×), a’, b’, and c’ correspond to a, b, and c in A, respectively. C, Quantification of the wound widths. Statistical analyses: one-way ANOVA with Tukey’s multiple comparison test (n = 4). Mean ± SEM. n.s., no statistical significance; *, P < 0.05; **, P < 0.01; ***, P < 0.001
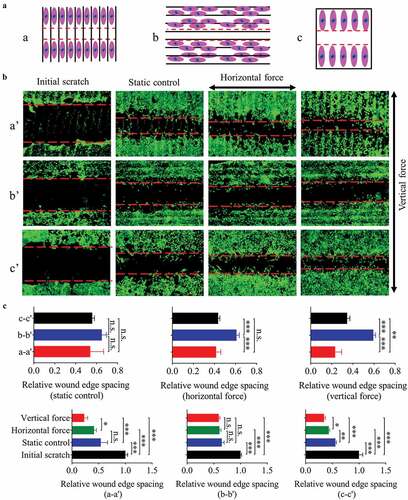
Figure 5. Adhesion of NIH-3T3 cells at 24 h after incubating on groove patterns. (a) Fluorescent images of actin and vinculin of fibroblasts. The merged images consist of F-actin (red), vinculin (green) and nucleus (blue). The force direction is vertical, and the static culture as a control. Scale bars: 100 μm. (b) Quantification of vinculin fluorescence intensity of fibroblasts seeded on grooves. (c) The protein expression (left) and quantitative analysis (right) of vinculin. The values are normalized to β-actin. Statistical analyses: two-way classification ANOVA with Tukey’s multiple comparison test (n ≥ 5, cell counts>50). Mean ± SD. n.s., no statistical significance; *, P < 0.05; ***, P < 0.001
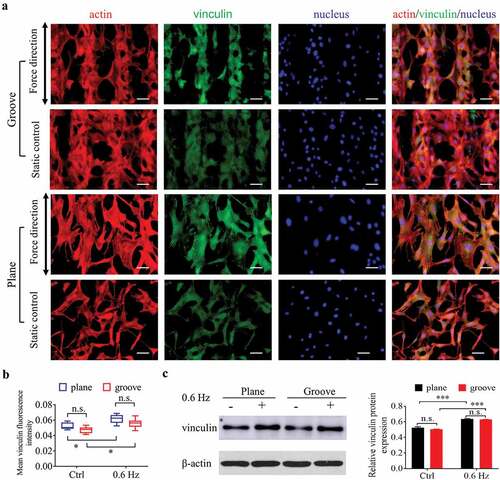
Figure 6. The differentiation of BMSCs seeded on plane and groove structures for 24 h. (a), Fluorescent images of cytoskeleton and α-SMA of BMSCs. Images are taken in black-and-white mode of fluorescence microscopy, and merged pictures are added with pseudo-color, including red (F-actin), green (α-SMA) and blue (nucleus). The force direction is vertical, with the static culture as a control. Scale bars: 100 μm. (b) Mean single cell area. (c–d) Mean Col-I (c) and α-SMA (d) fluorescence intensity. (e) Ratio of cells on the ridge to groove. (f) The protein expression of Col-I and α-SMA. (g) Quantifying the gray value of protein bands, the proteins are normalized to β-actin. Statistical analyses: two-way classification ANOVA with Tukey’s multiple comparison test (b-d, g); two-tailed Student’s t-test (e). n = 9, cell counts>50 (b-e), n = 3 (g). Mean ± SD (b-d, e, g). n.s., no statistical significance; *, P < 0.05; **, P < 0.01; ***, P < 0.001
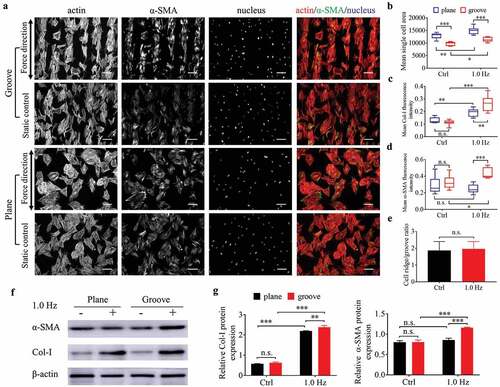
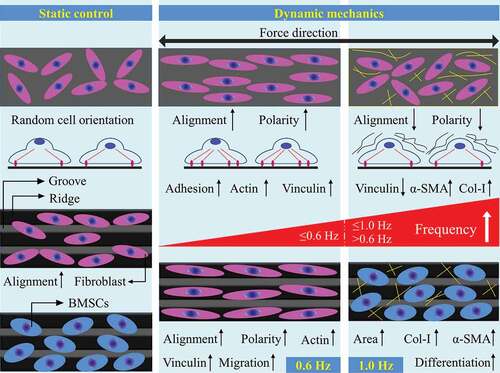
Figure 7. A schematic diagram of the effect of fluid shear stress on the behavior of fibroblasts and BMSCs on plane and groove substrates
Supplemental Material
Download MS Word (5.9 MB)Data Availability Statement
All data that support the conclusions are available from the authors on request. https://mail.126.com/js6/main.jsp?sid=LBdPdGzzEPKdpnkPjHzzvGfpEEJLjYwQ&df=mail163_letter#module=welcome.WelcomeModule%7C%7B%7D