Figures & data
Figure 1. Chemical structure of thymol
Figure 2. AGE treatment activates RhoA in HPCs. (a) RhoA activation in HPCs treated for 4 h with increasing concentrations of AGE. (b) RhoA pull-down activity assay in HPCs treated with 100 μg/mL AGE over time. (Data are the mean ± S.D.; *P < 0.05 vs control, n = 3)
Figure 3. AGE treatment activates ROCK and the NF-κB signalling pathway in HPCs. (a) Detection of ROCK, p-IκBα, p-NF-κB after treatment with increasing concentrations of AGE for 48 h. (b) Detection of ROCK, p-IκBα, and p-NF-κB after exposure to 100 μg/ml AGE over time. (Data are the mean ± S.D.; *P < 0.05 vs control, n = 3)
Figure 4. Cell viability assays. HPCs were cultured with different concentrations of thymol, si-RhoA or si-NC in the presence of 100 μg/mL AGE for 48 h. The WST-8 assay showed that there was no significant difference in cell viability among all of the experimental groups. The values are presented as the mean ± S.D. (n = 4)
Figure 5. Thymol exhibited pleiotropic protective effects, which were induced by AGE. (a) ELISA indicated that the high expression levels of IL-6 and TNF-α in AGE-stimulated HPCs were restored by thymol in a dose-dependent manner. (Data are the mean ± S.D.; *P < 0.05 vs control, n = 3). (b) The high apoptosis rate that was induced by AGE was restored by thymol in a dose-dependent manner, according to flow cytometry results. EA represents early apoptosis and LA represents late apoptosis. (c) The cytoskeleton of HPCs stained by FITC-phalloidin showed that the rearrangement induced by AGE can be efficiently restored by thymol. (d) The low expression level of podocin in HPCs treated with AGE was significantly rescued by thymol, as detected by IF. (e/f) The cell migration capacity was detected by a wound healing assay (e) and a Transwell assay (f). The results showed that AGE induced a strengthened migration capacity, but this could be alleviated by thymol. (g) Semiquantitative analysis of the wound healing assay (e) and transwell assay (f). (Data are the mean ± S.D.; *P < 0.05 vs control, n = 3)
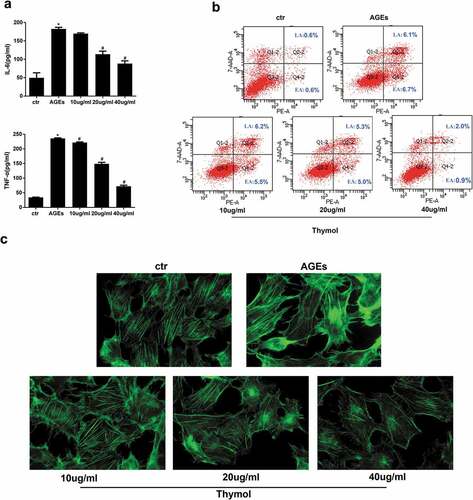
Figure 5. Continued
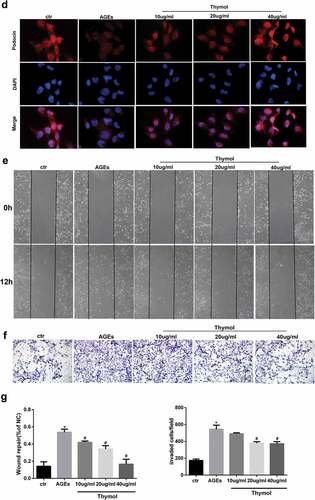
Figure 6. Thymol can reverse the expression of nephrin, podocin and vimentin by inhibiting the RhoA/NF-κB signalling pathway. (a). Nephrin, podocin vimentin and ROCK protein expression and the phosphorylation of NF-κB p65 and IκBα in HPCs were detected by western blot; β-actin served as an internal control. The results showed that thymol could significantly restore the expression of these molecules, which were induced by AGE in a dose-dependent manner. (b) RhoA-GTP was detected by pull-down assay. The results showed that thymol could inhibit it activation. Ctr group indicates the BSA control group; AGE indicates the AGE-stimulated group; 10, 20, and 40 refer to AGE plus 10 μg/ml, 20 μg/ml or 40 μg/ml thymol. (Data are the mean ± S.D.; *P < 0.05 vs control, # P < 0.05 vs AGE. n = 3)
Figure 7. Detection of RhoA silencing effect. The silencing efficiency of si-RhoA was detected by western blot. After RhoA was silenced, the expression of total RhoA and RhoA-GTP were both downregulated. (Data are the mean ± S.D.; *P < 0.05 vs si-NC, n = 3)
Figure 8. Effects of RhoA silencing on cytokine expression, the cytoskeleton and cell migration capacity. (a) ELISA revealed that the IL-6 and TNF-α levels can be significantly downregulated by si-RhoA. (Data are the mean ± S.D.; *P < 0.05 vs control, #P < 0.05 vs AGE. n = 3). (b) Cytoskeleton staining by FITC-phalloidin showed that RhoA silencing can restore disordered cytoskeleton. (c/d) The cell migration capacity was detected by a wound healing assay (c) and Transwell assay (d). The results showed that the strengthened migration capacity could be alleviated by si-RhoA treatment. Ctr indicates the normal control group. AGE indicates the AGE-stimulated group. si-RhoA indicates the AGE plus si-RhoA group, and si-NC indicates the si-NC plus AGE group. (Data are the mean ± S.D.; *P < 0.05 vs control, # P < 0.05 vs AGE. n = 3)
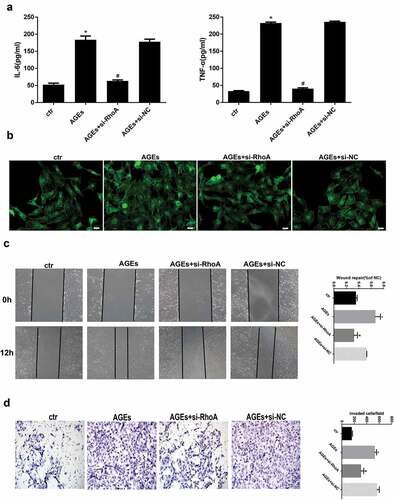
Figure 9. Effect of si-RhoA or ROCK inhibitor on the NF-κB signalling pathway and cell injury. (a) Nephrin, podocin and vimentin protein expression and the phosphorylation of NF-κB/p65, IκBα and ROCK in HPCs were detected by western blot; β-actin served as an internal control. si-RhoA could efficiently restore their expression. (b) The ROCK inhibitor fasudil and Y-27,632 could significantly restore the expression of the above molecules, which were induced by AGE. (Data are the mean ± S.D.; *P < 0.05 vs control, #P < 0.05 vs AGE. n = 3)