
Figures & data
Figure 1. Influence of Ruta Graveolens 9CH on cell stiffness of living individual B16F10 cells.
Determination of cell stiffness was conducted with Atomic Force Microscopy (AFM) by Peak Force Quantitative Nanomechanical Mapping measurements (PFQNM mode). After 1 h of treatment with 5% of Ruta graveolens 9CH or control, cell stiffness of dispersed living B16F10 cells, seeded on fibronectin, was studied for their elastic properties (Pa). (a) Topographic images are represented in 3D, while the color code is linked to the cell Young’s modulus values (log Pa unit) according to the experimental conditions. Both are representative of the cell behavior for each condition. (b) The average values of Young’s Modulus on perinuclear areas are represented in box and whiskers, n = 3, ***p < 0.001. Data are expressed as means ± SEM.
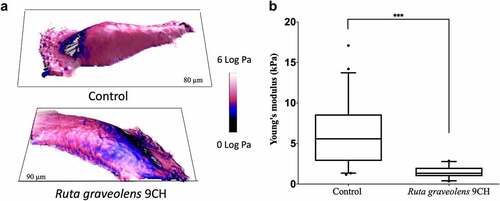
Figure 2. Effects of Ruta Graveolens 9CH on phospholipid membrane organization.
B16F10 cells were seeded on fibronectin, incubated with Laurdan [5 μM] overnight at 37°C and then treated with 5% homeopathic drug or control. After 1 h, living cells were excited at 800 nm with a bi-photon confocal microscope, immersion objective 60× (scale bar, 10 μm). The camera then captures two simultaneous images with wavelengths range to 400–460 nm (liquid-ordered phase ‘lo’, in red) and 470–530 nm (liquid-disordered phase ‘ld’, in blue). (a) Representative confocal microscopy images according to experimental conditions where white arrows show ordered lipid phases. (b and c) Intensity of pixels was introduced in generalized polarization equation that provides GP values for Ruta graveolens 9CH and control conditions as measurements of membrane fluidity. Quantification of GP values are ranged from −1 (more fluid) to +1 (more gel), n = 3, *p < 0.05. Data are expressed as means ± SEM.
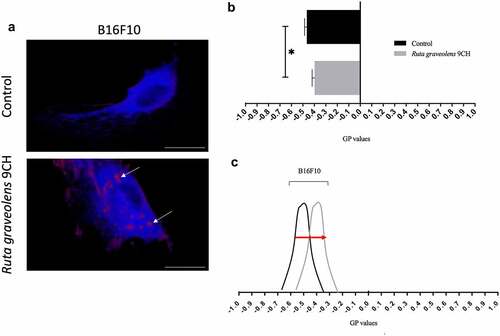
Figure 3. Effects of Ruta Graveolens 9CH on cholesterol.
(a) Representative images showing membrane cholesterol in Filipin-labeled B1610 cells (Obj ×20, scale bar, 10 μm). (b) Quantification of the amounts of free cholesterol fraction of B16F10 cells treated with 5% Ruta graveolens 9CH or control. Results are expressed as free cholesterol concentration (μg/ml). Means ± SEM of results are plotted, n = 3, *p < 0.05.
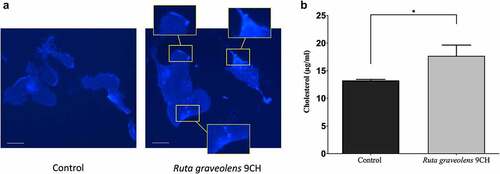
Figure 4. Effects of Ruta Graveolens 9CH on induced-calcium flows.
B16F10 cells were seeded in 2-well Labteks on fibronectin. The cells were incubated with Fluo-4 and placed under a fluorescence microscope. Ruta graveolens 9CH or control (5%), and ionomycin were directly injected into the well at 10 seconds during a real-time acquisition of 200 s. The fluorescence intensity of 10 random cells per condition was analyzed using the macro-trace–intensity-modif-modif-fluo4-multiROI. Data are expressed as means of Arbitrary Unit (AU) of fluorescence intensity ± SEM, n = 3, *p < 0.05.
Figure 5. Effects of Ruta Graveolens 9CH on actine organization.
B16F10 cells were seeded on fibronectin and treated for 1 h with 5% Ruta graveolens 9CH or control. Cells were fixed with glutaraldehyde, permeabilized with TritonX-100 and stained with Phalloïdin-Alexa Fluor 488 (actin filament in green). (a) Representative cells treated with control (top) or Ruta graveolens (bottom) stained with Phalloidin and visualized with an epifluorescence microscope, objective 20× (scale bar, 10 μm). The white arrows show actin stress fibers, and dotted white circles show a disruption of cortical actin. (b) Quantified profile types like stress fibers organized (in gray) or disorganized (light gray) actin networks in each condition and representative of presented data using Image J software. They are expressed in means normalized in percentage ± SEM, n = 3 where 60 random cells were analyzed per condition and experiment, **p < 0.01.
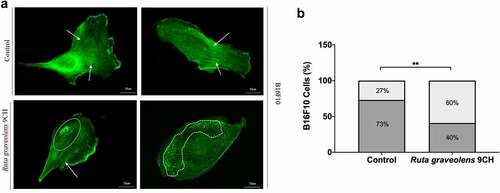
Figure 6. Effects of Ruta Graveolens 9CH on B16F10 2D dispersed migration, 3D migration and circularity.
(a) For 2D dispersed migration, B16F10 cells were seeded on fibronectin, treated with 5% of Ruta graveolens 9CH or control and random cells were tracked for 24 h using Manual Tracking plugin. Data obtained were analyzed by chemotaxis plugin (trajectories of 60 random cells per image) on ImageJ software, and quantification of average distance traveled in 24 h was expressed in μm, n = 3. (b) For 3D cell migration, B16F10 cells were seeded on Boyden chamber coated with fibronectin, treated with 5% of Ruta graveolens 9CH or control and allowed to migrate for 6 h. Percentage of nuclei (under the polycarbonate membrane) was counted by ImageJ software, n = 3 (scale is 50 μm). (c) The average cell circularity (from 0 to 1 in the sense of circularity) was studied with ImageJ from 60 random cells from 2D dispersed migration at 24 h, n = 3. Data are expressed as means ± SEM. *p < 0.05, ***p < 0.01, ***p < 0.001.
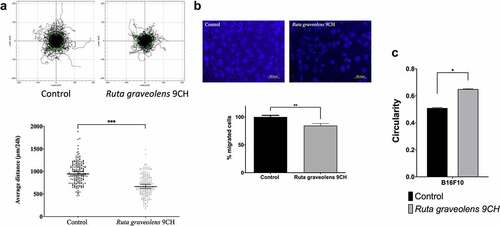
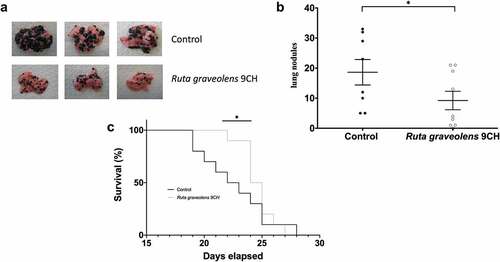
Figure 7. Effects of Ruta Graveolens 9CH on in vivo lung metastasis and survival.
B16F10 cells were injected into the tail vein of mice at J0. (a) Representative images of the lungs of Ruta graveolens 9CH-treated and untreated mice after 15 days. (b) Quantification of the number of lung nodules in both experimental conditions. (c) Kaplan–Meier survival curve with control (black) and Ruta graveolens 9CH (gray). Data are expressed as means ± SEM. *p < 0.05.
Data availability statement
The data that support the findings of this study are available from the corresponding author upon reasonable request