
Figures & data
Figure 1. MANS peptide treatment does not inhibit fMLP-induced β2-integrin affinity conformation change of neutrophils. Neutrophils were pretreated with 50 µM MANS, 50 µM RNS, 10 mM EDTA, or PBS (untreated) for 30 minutes then stimulated with 100 nM fMLP or vehicle control (DMSO) for 5 minutes. Flow cytometry was used to measure total CD11b (ICRF44) (a-b) and high affinity CD11b (CBRM1/5) (c-d) as described. Histograms (b & d) show unstimulated (UTC) cells stained with IgG1 isotype control in red, DMSO (vehicle control/unstimulated) treated in blue, fMLP in green, MANS treated cells in orange, RNS treated cells in cyan, and EDTA (positive control for inhibition) in magenta. Data are represented as mean ± SD, n = 4–9. Mixed-effects analysis with Dunnett’s multiple comparisons test. *p < .05, ** p < .01, *** p < .001, **** p < .0001 indicates when compared to fMLP stimulation.
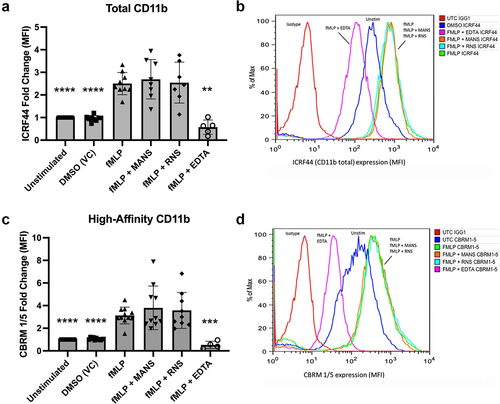
Figure 2. MANS peptide treatment attenuates outside-in β2-integrin-mediated neutrophil adhesion. Neutrophils were pretreated with indicated concentrations of MANS and RNS peptides, 30 µg/mL anti-CD18 F(ab)’2, or 30 µg/mL IgG2a control F(ab)’2 for 30 minutes prior to application to 96 well plate coated with 10 μg/mL ICAM-1. Cells were allowed to settle for 10 minutes before application of 0.5 mM Mn2+ for 10 minutes. Adhesion was quantified as described in the materials and methods section. MANS inhibition of MARCKS demonstrated concentration-dependent inhibition of ICAM-1+Mn-induced adhesion. Data represented as mean ± SD, n = 5–6. Mixed-effects analysis with Dunnett’s multiple comparisons test. * p < .05, ** p < .01, *** p < .001, **** p < .0001 indicates when compared to ICAM-1 + Mn group.
Figure 3. MANS peptide treatment alters neutrophil spreading and β2-integrin clustering on ICAM-1 enhanced with Mn2+. fMLP does not restore defects. Immunofluorescence microscopy of CD11b: Neutrophils were pretreated with 50 µM MANS, 50 µM RNS, or PBS for 30 minutes prior to application to ICAM-1 coated chambered coverslip. Cells were incubated for 10 minutes at 37°C. Mn2+ was added following the 10 minute incubation and allowed to adhere for another 10 minutes at 37°C. fMLP was applied 5 minutes into stimulation. (a) Neutrophils plated on 5% FBS in PBS. (b) Neutrophils plated on 5% FBS in PBS followed by Mn2+. (c) Neutrophils plated on ICAM-1. (d) Neutrophils plated on ICAM-1 and enhanced with Mn2+. (e) MANS pretreated neutrophils on ICAM-1 with Mn2+. (f) RNS pretreated neutrophils plated on ICAM-1 with Mn2+. (g) Neutrophils plated on ICAM-1/Mn2+ with fMLP applied 5 minutes into stimulation. (H) MANS pretreated neutrophils plated on ICAM-1/Mn2+ with fMLP applied 5 minutes into stimulation. (i) Percent spread cells in each condition. Data are represented as mean ± SD, n = 2.
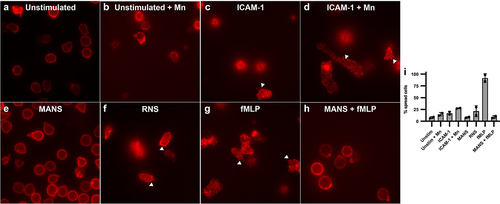
Figure 4. MANS peptide inhibits β2-integrin-dependent neutrophil respiratory burst stimulated by insoluble immune complexes but not PMA-stimulated β2-integrin independent neutrophil respiratory burst. Neutrophils were pretreated for 30 minutes with 30 µg/mL anti-CD18 F(ab)’2, 30 µg/mL IgG2a control F(ab)’2, 50 µM MANS, 50 µM RNS, 100 nM staurosporine, or media alone (control). Respiratory burst was quantified by DHR-123. Cells were stimulated by insoluble immune complexes (IIC) (a) or PMA (b). Data are represented as mean ± SD, n = 2–4. Individual time points were analyzed by one-way ANOVA with Dunnett’s multiple comparisons test. *p < .05, ** p < .01, *** p < .001, **** p < .0001 indicates MANS compared to IIC. #p < .05, # p < .01 indicates anti-CD18 F(ab)’2 compared to IIC. Staurosporine p < .05 for all time points beginning at 30 minutes.
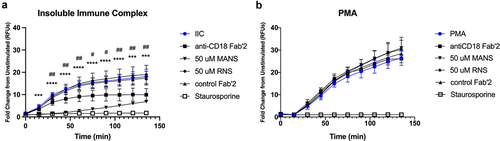
Figure 5. MANS peptide treatment does not alter IIC-induced p38 nor Akt activation in neutrophils. Neutrophils (7x10⁶) were pretreated with either PBS, 50 µM MANS, 50 µM RNS, 30 µM PP2 (positive control for inhibition), or 30 µg/mL anti-CD18 F(ab)’2 then stimulated on low density immune complexes for 15 minutes or left in suspension (Sus). Phosphorylation of p38 or Akt was analyzed by Western blotting of whole-cell lysates. Equal loading was confirmed following transfer with Invitrogen No-Stain Protein Labeling Reagent. The percentage of phosphop38 or phosphoAkt was determined based on the total protein in the respective lane and the signal of the phosphop38 or phosphoAkt band. Blot shown is representative of three independent experiments. Data are represented as mean ± SD, n = 3. One-way ANOVA with Dunnett’s multiple comparisons test. *p < .05, *p < .01 indicates when compared to IIC.
Supplemental Material
Download MS Word (1.5 MB)Data availability statement
The original contributions presented in the study are included in the article and supplementary material. Data files can also be found at https://doi.org/10.5281/zenodo.8121775. Further inquiries can be directed to the corresponding author at [email protected].