Figures & data
Figure 1. Silencing of PAF1 down-regulated FLOT2 expression in CC. (a) the correlation between PAF1 and FLOT2 in CC tissues was confirmed through TIMER 2.0 online website. (b) the protein expressions of PAF1 and FLOT2 were detected in normal tissues and CC tumor tissues through western blot. (c) the correlation between PAF1 and FLOT2 in CC tissues (n = 25) was verified. (d) the mRNA expression of PAF1 and FLOT2 were examined in human normal cervical epithelial cell line (HcerEpic) and CC cell lines (HeLa, C33A, SiHa, CaSki) through RT-qPCR. (e) the protein expression of PAF1 and FLOT2 were detected in human normal cervical epithelial cell line (HcerEpic) and CC cell lines (HeLa, C33A, SiHa, CaSki) through western blot. (f-g) the mRNA and protein expressions of PAF1 and FLOT2 were tested in HeLa and C33A cells after PAF1 knockdown through RT-qPCR and western blot. *p < 0.05, **p < 0.01, ***p < 0.001.
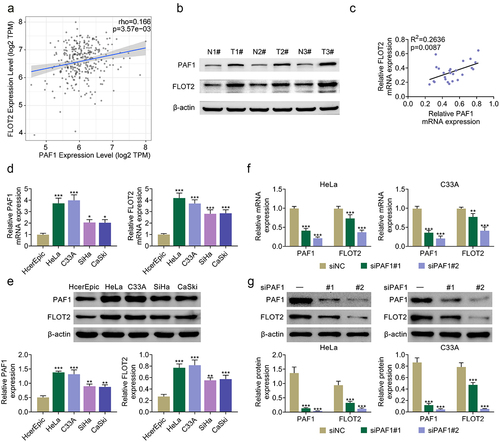
Figure 2. Suppression of PAF1 weakened CC cell proliferation and strengthened cell apoptosis through modulating FLOT2. Groups were separated into the control, siNc+vector, siPaf1#2+vector, siNC+FLOT2 and siPAF1#2+FLOT2 group. (a) the protein expression of PAF1 and FLOT2 were measured in HeLa and C33A cells through western blot. (b-c) the cell proliferation was verified in HeLa and C33A cells through CCK-8 and colony formation assays. (d) the cell apoptosis was identified in HeLa and C33A cells through TUNEL assay. *p < 0.05, **p < 0.01, ***p < 0.001 vs the siNc+vector group; ^p < 0.05, ^^p < 0.01, ^^^p < 0.001 vs the siPaf1#2+vector group; &p < .05, &&p < .01, &&&p < .001 vs the siNC+FLOT2 group.
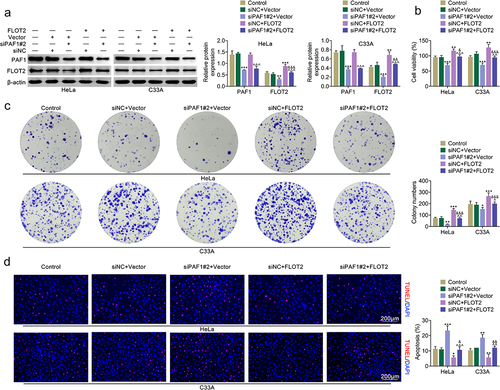
Figure 3. Knockdown of PAF1 reduced CC cell migration and invasion through modulating FLOT2. Groups were separated into the control, siNc+vector, siPaf1#2+vector, siNC+FLOT2 and siPAF1#2+FLOT2 group. (a-b) the cell migration was confirmed in HeLa and C33A cells through wound healing assay. (c-d) the cell invasion was assessed in HeLa and C33A cells through Transwell assay. (e) the protein expression of Vimentin, N-cadherin and E-cadherin were evaluated in HeLa and C33A cells through western blot. *p < 0.05, **p < 0.01, ***p < 0.001 vs the siNc+vector group; ^p < 0.05, ^^p < 0.01, ^^^p < 0.001 vs the siPaf1#2+vector group; &p < 0.05, &&p < 0.01, &&&p < 0.001 vs the siNC+FLOT2 group.
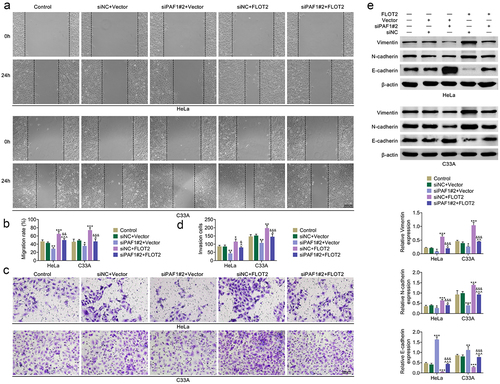
Figure 4. Inhibition of PAF1 slowed the tumor growth in vivo through modulating FLOT2. Groups were separated into the siNc+vector, siPaf1#2+vector, siNC+FLOT2 and siPAF1#2+FLOT2 group. (a) the tumor size, volume and weight were determined through in vivo assay. (b) the protein expressions of PAF1, FLOT2 and Ki67 in tumor tissues were tested through IHC assay. ***p < 0.001 vs the siNc+vector group; ^^^p < 0.001 vs the siPaf1#2+vector group; &&&p < 0.001 vs the siNC+FLOT2 group.
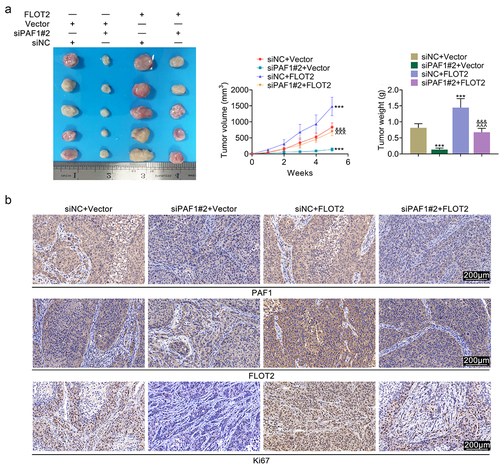
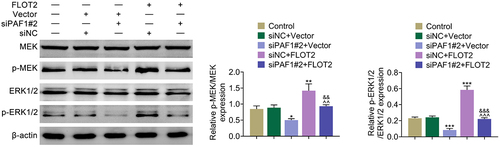
Figure 5. Repression of PAF1 retarded the MEK/ERK1/2 pathway through modulating FLOT2. Groups were separated into the control, siNc+vector, siPaf1#2+vector, siNC+FLOT2 and siPAF1#2+FLOT2 group. The protein expression of MEK, p-MEK, ERK1/2 and p-ERK1/2 were examined in HeLa cells through western blot. *p < 0.05, **p < 0.01, ***p < 0.001 vs the siNc+vector group; ^^p < 0.01, ^^^p < 0.001 vs the siPaf1#2+vector group; &&p < 0.01, &&&p < 0.001 vs the siNC+FLOT2 group.