Figures & data
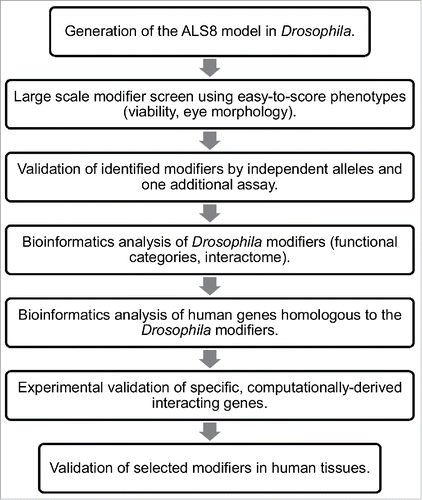
Figure 1. Df(3L)ED225 suppresses DVAP-P58S-induced eye phenotype. Scanning electron microscopy images of (A) ey-Gal4/+ control flies, (B) ey-Gal4, UAS-DVAP-P58S/+ and (C) ey-Gal4, UAS-DVAP-P58S/+; Df (3L)ED225/+ flies. Flies in (D), (E) and (F) are higher magnifications of the genotypes in (A), (B) and (C) respectively. Scale bars: 100 µm. (G) 60% of ey-Gal4, UAS-DVAP-P58S/+ flies (white) have eye size areas centered between 1500 and 2000 arbitrary square units (N=61, SD=654) and 5% had eye sizes around 50 arbitrary square units compared to 74% of ey-Gal4, UAS-DVAP-P58S/+; Df(3L)ED225/+ flies (black) that are centered between 3000 and 3500 arbitrary square units and 10% at 4000 arbitrary square units (N=36, SD=378) that is toward control values (60% centered around 4500 arbitrary square units and 20% centered around 4000 and 4750 arbitrary square units respectively. Grey, N=20, SD=261). Differences between eye size distributions of ey-Gal4, UAS-DVAP-P58S/+ flies and ey-Gal4, UAS-DVAP-P58S/+; Df(3L)ED225/+flies were highly significant (P<0.001, according to the non-parametric Mann-Whitney U test when comparing the 2 data sets). Differences between the distributions of eye sizes between ey-Gal4, UAS-DVAP-P58S/+ and control flies were highly significant (P<0.001, according to the non-parametric Mann-Whitney U test when comparing the 2 data sets). (H). Table reporting that the deficiency screen identified 9 genomic deficiencies as suppressors and 4 as an enhancers of the DVAP-P58S eye phenotype. Sem experiments were performed as previously described.Citation16 Quantification of the eye phenotype was performed using Oculus v.1, an in-house developed software.Citation17
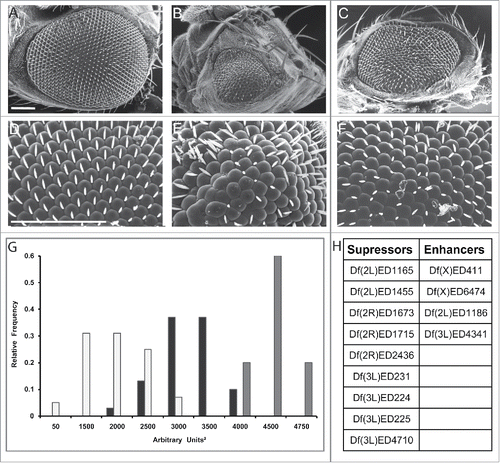
Figure 2. Flowchart of the screen for genetic modifiers of ALS8. The screening process in Drosophila followed by computational analysis of modifiers both in Drosophila and in humans and validation of a specific subset of modifiers in human tissues are depicted.