Figures & data
Figure 1. The Drosophila melanogaster posterior midgut epithelium. (a) Confocal immunostaining image of a posterior midgut showing the 4 cell types and their lineage relationships. ISC is pseudocolored in green, EB is pseudocolored in purple, EEs are stained in red by Prospero (nuclear), and ECs are identified based on their polyploid nuclei (stained by DAPI, in blue). (b, b’) Vertical section through the midgut epithelium. Mesh (red), a sSJ protein, is located apically in ECs (polyploid nuclei stained in blue). (c) Apical localization of the septate junction protein Scribble (green) compared to the adherens junction protein Armadillo (Arm, red). Arrowheads depict the enrichment of Scribble at the TCJs. (d) Confocal image of posterior midgut showing the localization of Gli-GFP (green) at the TCJs. Gli is mis-localized from TCJs (arrowheads) in posterior midguts from 50do flies comparing to 5do.
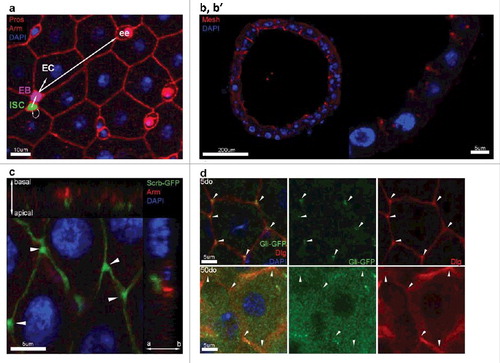
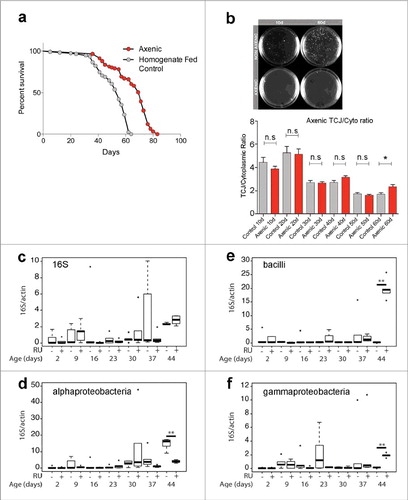
Figure 2. (a) Lifespan curves for Gli:GFP (DGRC 115332) female flies (raised on under axenic conditions (red) or control flies rasied under axenic conditions and then refed homogenized flies to reconstitute the intestinal microbiome (grey). T50 and total lifespan were significantly lower in controls, when compared with axenic. Data were analysed with a non-parametric log-rank (Mantel–Cox) test; ∗∗∗∗, P < 0.0001, represents a statistically significant difference. (b) MRS plates showing bacterial presence from cultured fly homogenates in non-axenic flies and total absence of bacterial colonies from axenic flies at 10do and 60do. TCJ/Cytoplasm fluorescence ratio for Gli in axenic flies shows no statistical differences until later time point d60 compared to control flies. Asterisks represent a statistically significant difference in an unpaired Student's t-test, two tailed, indicated by the corresponding bars (* = P<0,01). 10do Ctrl n = 21 midguts; 10do Axenic n = 20; 20do Ctrl n = 20; 20do Axenic n = 21; 30do Ctrl n = 20; 30do Axenic n = 20; 40do Ctrl n = 16; 40do Axenic n = 16; 50do Ctrl n = 20; 50do Axenic n = 20; 60do Ctrl n = 20; 60do Axenic n = 20. Each data point (n = midguts) represents an average fluorescence intensity ratio from 2–7 independent measurements per midgut and the error bars are the S.E.M range of those averages. (c-f) Alterations in microbiota composition are not linked to loss of TCJ. Targeted Gli is depleted from ECs using the 5966GS GAL4 ‘driver’, when flies are fed with the progesterone analogue RU486(RU+); addition of ethanol is used as a control (RU-). Bacterial levels assayed by qPCR at different time points, of the 16S ribosomal RNA gene in dissected intestines. With universal (c), Alphaproteobacteria (d), Bacilli (e) and Gammaproteobacteria (f) primers. No significant differences were detected in bacterial expression, after 2, 9, 16, 23, 30, 37 days post Gli-RNAi expression (RU+) compared to control (RU-). Only at day 44, significant changes were scored. Boxplots display the first and third quartile, with horizontal bar at the median and whiskers showing the most extreme data point, which is no more than 1.5 times the interquartile range from the box.∗∗ = P < 0.01, represent statistically significant difference.