Figures & data
Table 1. GAL4 drivers used in the study.
Table 2. RNAi lines used in the study.
Table 3. Other Drosophila strains used in the study.
Figure 1. tko25t developmental delay is partially alleviated by tko+ expression directed by different drivers. Time to eclosion (means ± SD, n ≥ 3 replicate vials for each cross), of flies of the indicated genotypes, using UAS-tko+(8) with the indicated drivers. Controls were FM7 balancer flies with (a, b and d – right-hand panel) driver but no transgene, (c), driver or transgene (these classes could not be distinguished due to the nature of the cross, since the G14 driver is not viable as a homozygote), and (d – left-hand panel) neither transgene nor driver, as dictated by the chromosomal location of the drivers. Because the elav-GAL4 driver is located on the X chromosome, one of the two reciprocal crosses used in (d) generates only informative females and not males. Horizontal lines denoted by asterisks (*, **, ***) indicate significant differences in pairwise comparisons of flies of a given sex and tko genotype, with and without actively driven tko+ (Student’s t test, p < 0.05, 0.01, 0.001, respectively. The specificity of each driver was confirmed by parallel crosses in which it was used to direct the synthesis of nuclear- or membrane-localized GFP (see Fig. S1). Note that we avoided the use of the TM3 balancer because we established that it conferred a developmental delay in conjunction with tko25t, whereas the chromosome 2 balancer CyO did not (Fig. S2). The partial rescue of developmental delay was also observed at other temperatures with some drivers (see Table S1) and using the alternate transgene UAS-tko+(1) – see . Note that most GAL4 drivers exhibit the classic pattern of temperature dependence [Citation38], i.e. increased activity at higher temperature. However, for the strongest drivers, this may also lead to deleterious effects of over-expression at high temperature, such that a lower temperature produces optimal effects.
![Figure 1. tko25t developmental delay is partially alleviated by tko+ expression directed by different drivers. Time to eclosion (means ± SD, n ≥ 3 replicate vials for each cross), of flies of the indicated genotypes, using UAS-tko+(8) with the indicated drivers. Controls were FM7 balancer flies with (a, b and d – right-hand panel) driver but no transgene, (c), driver or transgene (these classes could not be distinguished due to the nature of the cross, since the G14 driver is not viable as a homozygote), and (d – left-hand panel) neither transgene nor driver, as dictated by the chromosomal location of the drivers. Because the elav-GAL4 driver is located on the X chromosome, one of the two reciprocal crosses used in (d) generates only informative females and not males. Horizontal lines denoted by asterisks (*, **, ***) indicate significant differences in pairwise comparisons of flies of a given sex and tko genotype, with and without actively driven tko+ (Student’s t test, p < 0.05, 0.01, 0.001, respectively. The specificity of each driver was confirmed by parallel crosses in which it was used to direct the synthesis of nuclear- or membrane-localized GFP (see Fig. S1). Note that we avoided the use of the TM3 balancer because we established that it conferred a developmental delay in conjunction with tko25t, whereas the chromosome 2 balancer CyO did not (Fig. S2). The partial rescue of developmental delay was also observed at other temperatures with some drivers (see Table S1) and using the alternate transgene UAS-tko+(1) – see Figure 2. Note that most GAL4 drivers exhibit the classic pattern of temperature dependence [Citation38], i.e. increased activity at higher temperature. However, for the strongest drivers, this may also lead to deleterious effects of over-expression at high temperature, such that a lower temperature produces optimal effects.](/cms/asset/6efc666f-8f41-40ca-9071-d58262808c02/kfly_a_1662266_f0001_c.jpg)
Figure 2. Alleviation of tko25t developmental delay in a second UAS-tko+ line. Time to eclosion at 25°C (means ± SD, n ≥ 3 replicate vials for each cross), of flies of the indicated genotypes, using various drivers plus the UAS-tko+(1) transgene, shown previously to confer a modest rescue of developmental delay without any driver [Citation6]. Controls were FM7 balancer flies with transgene but without driver, as shown. Horizontal lines denoted by asterisks (*, **, ***) indicated significant differences in pairwise comparisons of flies of a given sex and tko genotype, with and without actively driven tko+(Student’s t test, p < 0.05, 0.01, 0.001, respectively. The specificity of each driver was confirmed by parallel crosses in which it was used to direct the synthesis of nuclear- or membrane-localized GFP (see Figure S1). Note that we avoided the use of the TM3 balancer because we established that it conferred a developmental delay in conjunction with tko25t, whereas the chromosome 2 balancer CyO did not (Fig. S2).
![Figure 2. Alleviation of tko25t developmental delay in a second UAS-tko+ line. Time to eclosion at 25°C (means ± SD, n ≥ 3 replicate vials for each cross), of flies of the indicated genotypes, using various drivers plus the UAS-tko+(1) transgene, shown previously to confer a modest rescue of developmental delay without any driver [Citation6]. Controls were FM7 balancer flies with transgene but without driver, as shown. Horizontal lines denoted by asterisks (*, **, ***) indicated significant differences in pairwise comparisons of flies of a given sex and tko genotype, with and without actively driven tko+(Student’s t test, p < 0.05, 0.01, 0.001, respectively. The specificity of each driver was confirmed by parallel crosses in which it was used to direct the synthesis of nuclear- or membrane-localized GFP (see Figure S1). Note that we avoided the use of the TM3 balancer because we established that it conferred a developmental delay in conjunction with tko25t, whereas the chromosome 2 balancer CyO did not (Fig. S2).](/cms/asset/32985f41-320e-4413-a56e-db994aa3bc6f/kfly_a_1662266_f0002_c.jpg)
Figure 3. RNAi knockdown of tko by different drivers results in developmental delay. Times to eclosion (means ± SD, n ≥ 3 replicate vials for each cross) for flies of the indicated sex and genotype, using the various drivers at the temperatures shown. Horizontal lines denoted by asterisks (*, **, ***) indicate significant differences in pairwise comparisons between knockdown and control flies of a given sex, using a given driver (Student’s t test, p < 0.05, 0.01, 0.001, respectively). Note that males were in general more severely affected and in some cases (e.g. da-GAL4) too few males eclosed to permit a statistically meaningful analysis. Note that most GAL4 drivers exhibit the classic pattern of temperature dependence [Citation38], i.e. increased activity at higher temperature. However, for the strongest drivers this may also lead to highly deleterious effects at high temperature, such that, at a lower temperature, results are more informative.
![Figure 3. RNAi knockdown of tko by different drivers results in developmental delay. Times to eclosion (means ± SD, n ≥ 3 replicate vials for each cross) for flies of the indicated sex and genotype, using the various drivers at the temperatures shown. Horizontal lines denoted by asterisks (*, **, ***) indicate significant differences in pairwise comparisons between knockdown and control flies of a given sex, using a given driver (Student’s t test, p < 0.05, 0.01, 0.001, respectively). Note that males were in general more severely affected and in some cases (e.g. da-GAL4) too few males eclosed to permit a statistically meaningful analysis. Note that most GAL4 drivers exhibit the classic pattern of temperature dependence [Citation38], i.e. increased activity at higher temperature. However, for the strongest drivers this may also lead to highly deleterious effects at high temperature, such that, at a lower temperature, results are more informative.](/cms/asset/64e20078-e9ee-4581-a176-066848f34899/kfly_a_1662266_f0003_c.jpg)
Figure 4. RNAi knockdown of tko by different drivers results in bang-sensitivity. Box-plots of recovery times from mechanical shock (bold black or red lines – medians, respectively, for controls and tko knockdown flies, with filled boxes representing first to third quartiles) of flies of the indicated genotype, sex and culture temperature. Note the different scales required to plot these data. White bars for control flies were in most cases not plottable, since median and both quartiles were at or very close to zero.
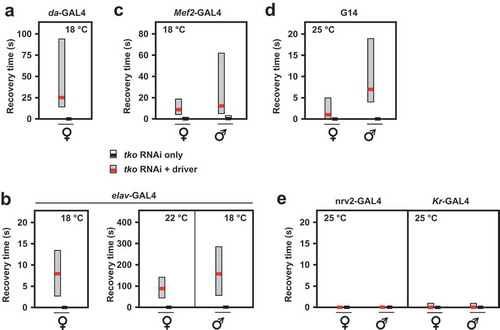
Figure 5. Drugs affecting pyruvate metabolism modify the tko25t phenotype. Means ± SD of times to eclosion of flies of the indicated genotypes and sex, at 25°C, on different media: HS – standard high-sugar medium, ZS – zero sugar medium, with addition of the indicated drugs that were present throughout the experiment: pyr – pyruvate, 25 mg/ml in (a) and concentrations as indicated in (b), DCA – dichloroacetate, 12.5 mg/ml in (a) and concentrations as indicated in (b), UK5099 – 25 μg/ml. For statistical analysis of data from (a) by two-way ANOVA, see Figure S5. In summary, this revealed a significant effect of both genotype and drug addition (p < 0.001) for both diets and sexes, as well as an interaction between genotype and drug addition for both sexes on HS diet (p < 0.01) and for females only, on ZS diet (p < 0.001). Tukey post hoc HSD test (p < 0.05) was used, where appropriate, to determine the source of variation (see Figure S5 and comments in main text). Note that some of the data from (a) was previously published in [Citation7], but without this statistical analysis, but is included here for full comparison. For a summary diagram of the reactions targeted by these drugs and by RNAi (see .
![Figure 5. Drugs affecting pyruvate metabolism modify the tko25t phenotype. Means ± SD of times to eclosion of flies of the indicated genotypes and sex, at 25°C, on different media: HS – standard high-sugar medium, ZS – zero sugar medium, with addition of the indicated drugs that were present throughout the experiment: pyr – pyruvate, 25 mg/ml in (a) and concentrations as indicated in (b), DCA – dichloroacetate, 12.5 mg/ml in (a) and concentrations as indicated in (b), UK5099 – 25 μg/ml. For statistical analysis of data from (a) by two-way ANOVA, see Figure S5. In summary, this revealed a significant effect of both genotype and drug addition (p < 0.001) for both diets and sexes, as well as an interaction between genotype and drug addition for both sexes on HS diet (p < 0.01) and for females only, on ZS diet (p < 0.001). Tukey post hoc HSD test (p < 0.05) was used, where appropriate, to determine the source of variation (see Figure S5 and comments in main text). Note that some of the data from (a) was previously published in [Citation7], but without this statistical analysis, but is included here for full comparison. For a summary diagram of the reactions targeted by these drugs and by RNAi (see Figure 10).](/cms/asset/380d964f-2fb1-43b4-beb6-122203fbebb8/kfly_a_1662266_f0005_c.jpg)
Figure 6. RNAi-mediated knockdown of Mpc1 or Pdk modifies the tko25t phenotype. (A) Mpc1 or Pdk RNA levels measured by qRTPCR and (B) time to eclosion of flies of the indicated genotypes (i.e. with relevant RNAi construct or balancer as shown), at 25°C, means ± SD, n ≥ 3 vials from each cross on the indicated medium: HS – high-sugar medium, with or without the addition of 25 mg/ml pyruvate. Horizontal dotted lines represent the mean eclosion times of Oregon R females and tko25t females and males on HS medium, to facilitate comparisons. Statistical analysis by two-way ANOVA (Fig. S6) revealed a significant effect of genotype under all conditions, but both Mpc1 and Pdk knockdown produced significant effects and showed significant interaction with genotype only in HS medium supplemented with pyruvate; Mpc1 knockdown retarding the development only of wild-type and Pdk knockdown retarding only that of tko25t flies of both sexes. Note that, in panel ii of (B), the CyO balancer flies from panel i, generated in the same experiment, are presented as the best indicative control. The TM3 balancer chromosome, whether marked with Sb or Ser, confers a developmental delay of >1 d that precludes its use as a control in such experiments, other than to allow identification of the non-balancer RNAi-bearing flies. Apart from this, all comparisons between control and knockdown flies of a given sex and genotype were from the same experiment, although Oregon R and tko25t flies were analyzed from separate crosses, as were flies cultured on different media. For a summary diagram of the reactions targeted by RNAi and by various drugs see .
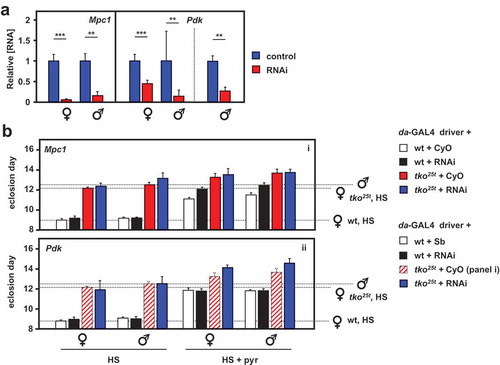
Figure 7. RNAi-mediated knockdown of Men (malic enzyme is synthetically (semi)lethal with tko25t. (a) Men RNA levels measured by qRTPCR and (b) time to eclosion of flies of the indicated genotypes (i.e. with relevant Men RNAi construct or balancer as shown), means ± SD, n ≥ 3 vials from each cross. Eclosion timing is shown for the temperature at which flies were also cultured for qRTPCR (25°C or 29°C as shown). Eclosion timing at the other temperature was qualitatively similar, as shown in Fig. S4A. Horizontal bars denoted by asterisks (**) indicate significant differences, in pairwise comparisons of RNAi and balancer control flies of each given genotype and sex analyzed (Student’s t test, p < 0.001). (c) Proportion (%) of eclosing RNAi male progeny that also carried tko25t, as opposed to the FM7 balancer, from crosses of the general type: tko25t/FM7; daGAL4 x FM7/Y; RNAi. Means ± SD, n ≥ 3 vials from each cross. Asterisks (***) above the bars denotes significant deviation from expected frequency of 50% (chi-squared test with Yates’ continuity correction, p < 0.001). See also Fig. S4. For a summary diagram of the reactions targeted by RNAi and by various drugs see .
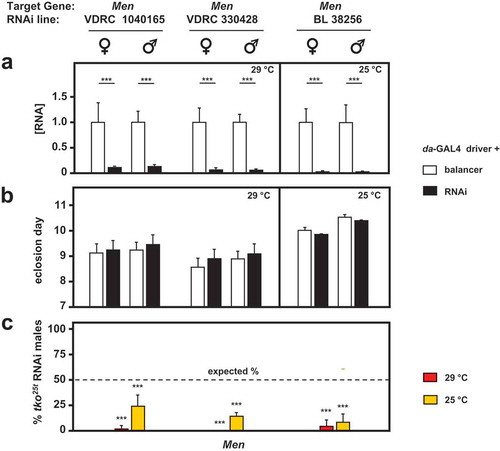
Figure 8. DCA modifies pyruvate and lactate levels oppositely from the effect of pyruvate addition. (a) Pyruvate and (b) lactate levels (means ± SD, n ≥ 3, generally four batches for each group) in L3 larvae of the indicated genotypes (OR = Oregon R wild-type). HS – high-sugar medium, ZS – zero-sugar medium, DCA – with addition of 12.5 mg/ml DCA, pyr, lac – with addition of 25 mg/ml pyruvate or lactate, respectively. Data are normalized to the values for wild-type on ZS medium. For statistical analysis, see Tables S3. For a summary diagram of the reactions targeted by drugs and RNAi see .
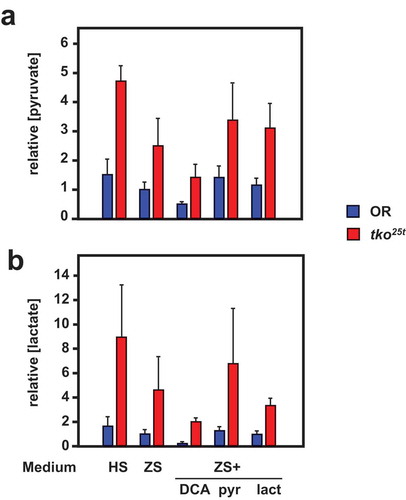
Figure 9. Gene expression changes induced by pyruvate are mostly different from those induced by high-sugar or tko25t. Plotted comparisons are based on analysis by (a) FPKM (mass-fraction) and (b) fold-change, with arbitrary threshold of 100 FPKM units or eightfold change, respectively. The plot ignores the actual direction of change and the nature of the regulated transcripts (protein-coding or non-coding RNA) but instead shows whether the direction of change is the same or different between the base-comparison (genes regulated by pyruvate addition to zero-sugar medium) and the comparisons as enumerated. In each case, the changes to the remaining genes from the base-comparison set did not pass statistical filtering in the other comparisons.
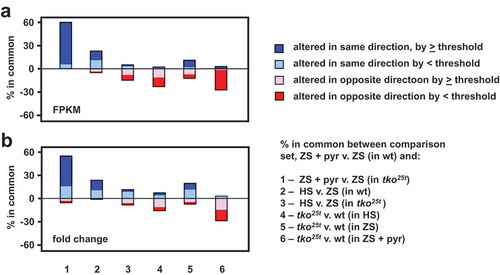
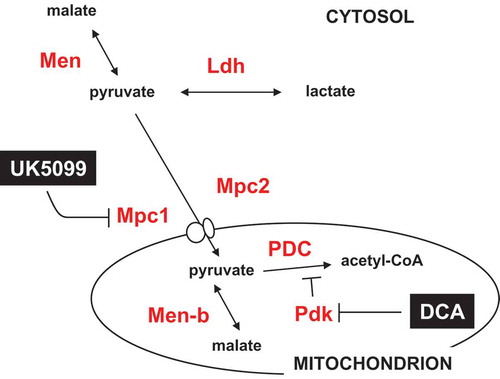
Figure 10. Summary diagram of steps in the pyruvate metabolic network targeted by drugs and RNAi. Metabolites are shown in black text, proteins in red, and drugs in white on black. Mpc1, Mpc2, Pdk, Men, Men-b and Ldh are shown by the systematic names from flybase. PDC – pyruvate dehydrogenase complex. For clarity, enzymes not targeted in the present experiments (such as pyruvate kinase and pyruvate carboxylase) are omitted.