
Figures & data
Figure 1. Overview of methods for calculating protein half-life in cells and organisms
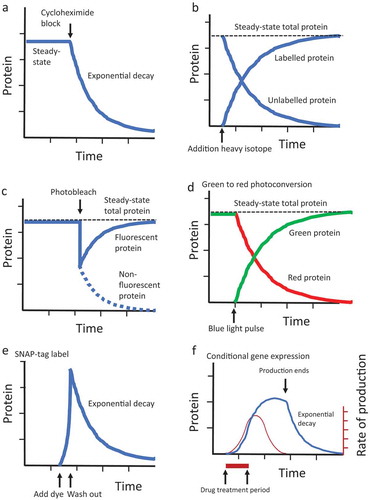
Figure 2. Fluorescent protein synthesis and turnover in free-moving adult Drosophila. (a) Neuronal expression of eGFP. The tissue-general Actin-Gene-Switch[255B] driver strain [Citation87] was crossed to the multi-copy UAS-eGFP strain (‘ultra-GFP’ [Citation29]), and six male progenies were placed in a glass vial with media supplemented with 160 μg/ml mifepristone (RU486). GFP fluorescence was quantified continuously using video and FluoreScore software, and is expressed in relative units (figure adapted from [Citation111]). Light green indicates average GFP intensity per minute and dark green is the LOESS curve. (b) Decay rate of GFP targeted to the mitochondrial matrix. mitoGFP is a mitochondria-targeted form of eGFP created by fusing the human COX VIII mitochondrial targeting signal to the N terminus of eGFP [Citation113]. In a proof-of-principle experiment, the tissue-general Actin-Gene-Switch[255B] driver strain was crossed to the UAS–mitoGFP[AP3] strain [Citation113], and male progeny (1–5 days of age) were placed in vials with media supplemented with 160 μg/ml mifepristone (RU486) or on control media. After 48 hours, all flies were transferred to glass culture vials with control media, at 6 flies per vial, using three replicate vials for drug treated flies and three replicate vials for controls (time 0). The flies were then assayed for GFP fluorescence at the indicated time points using 4 minute videos and FluoreScore software, and the average and SD of the three vials is plotted for each of (-) drug and (+) drug groups. The data suggests an in vivo half-life for mitoGFP of ~3 days
![Figure 2. Fluorescent protein synthesis and turnover in free-moving adult Drosophila. (a) Neuronal expression of eGFP. The tissue-general Actin-Gene-Switch[255B] driver strain [Citation87] was crossed to the multi-copy UAS-eGFP strain (‘ultra-GFP’ [Citation29]), and six male progenies were placed in a glass vial with media supplemented with 160 μg/ml mifepristone (RU486). GFP fluorescence was quantified continuously using video and FluoreScore software, and is expressed in relative units (figure adapted from [Citation111]). Light green indicates average GFP intensity per minute and dark green is the LOESS curve. (b) Decay rate of GFP targeted to the mitochondrial matrix. mitoGFP is a mitochondria-targeted form of eGFP created by fusing the human COX VIII mitochondrial targeting signal to the N terminus of eGFP [Citation113]. In a proof-of-principle experiment, the tissue-general Actin-Gene-Switch[255B] driver strain was crossed to the UAS–mitoGFP[AP3] strain [Citation113], and male progeny (1–5 days of age) were placed in vials with media supplemented with 160 μg/ml mifepristone (RU486) or on control media. After 48 hours, all flies were transferred to glass culture vials with control media, at 6 flies per vial, using three replicate vials for drug treated flies and three replicate vials for controls (time 0). The flies were then assayed for GFP fluorescence at the indicated time points using 4 minute videos and FluoreScore software, and the average and SD of the three vials is plotted for each of (-) drug and (+) drug groups. The data suggests an in vivo half-life for mitoGFP of ~3 days](/cms/asset/c0920afa-5345-453d-85c9-4e8f2e84e2ad/kfly_a_1911286_f0002_oc.jpg)
Data availability statement
The authors confirm that the data supporting the findings of this study are available within the article and its supplementary materials.