Figures & data
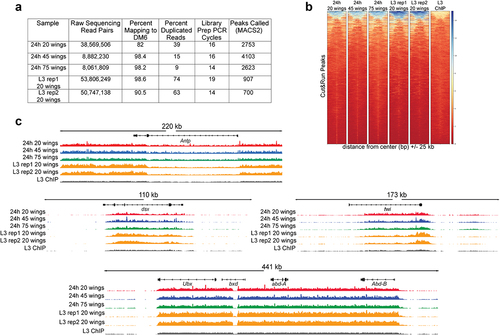
Figure 1. A wing dissociation protocol to release cells from cuticle and minimize cell death and loss. (a) Workflow diagram of assays compatible with gentle dissociation on larval and pupal tissues. Pupal tissues after 6 h into metamorphosis are encased within pupa cuticle and require dissociation for the subsequent assays. (b) Diagrams of pupal wing morphogenesis during metamorphosis. Notum (pink) is present in larval wings but absent from dissected pupa wings after 18 h APF. Larval and pupal wings contain hinge (yellow) and wing pouch (blue). (c) Diagram of pupa dissection (dotted lines) with image of 24 h APF pupa removed from the tanned pupal case. Wings are enclosed in shiny, translucent pupa cuticle and are manually dissected from the body at the hinge for dissociation. (d) Example flow cytometry plot of dissociated 24 h APF pupal wings. Cells were stained with a vital DNA dye (DyeCycle Violet) to discern cells from debris. Cell viability was assayed using a propidium iodide (PI) permeability assay and dead or dying cells were quantified based on gating of PI-positive cells. (e) Quantifications of viable vs. dead/dying cells in trypsin-based dissociation vs. collagenase/dispase dissociation in 24 h APF pupal wings and 24 h APF pupal eye/brain complexes.
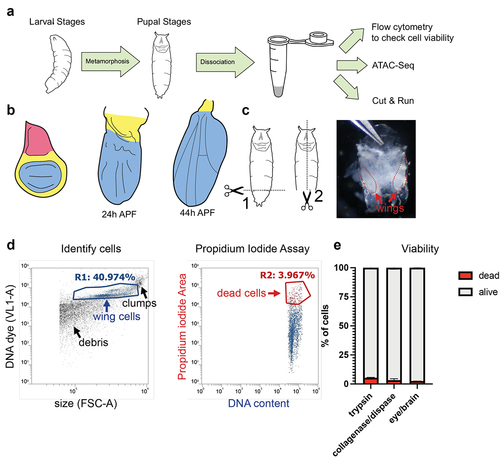
Figure 2. ATAC-Seq libraries from larval and pupal wings strongly correlate with accessibility profiles generated using FAIRE-Seq. (a) Accessibility profiles at the cycE gene locus generated using ATAC-Seq (red) and FAIRE-Seq (blue) from third larval instar (L3) wing discs and pupal wings at 24 and 44 h after puparium formation (APF). Arrows on gene diagram indicate the direction of transcription. Y-axes for ATAC-Seq and FAIRE-Seq tracks: normalized read counts per million. (b) Venn diagram depicting the overlap between ATAC-Seq and FAIRE-Seq peaks called from any time point. (c) Heatmap depicting the average signal intensity dynamics at the union set of all peaks defined by ATAC-Seq and FAIRE-Seq. Data are scaled by Z-score and hierarchically clustered based on ATAC-Seq dynamics. (d–f) Scatter plots depicting the signal intensity (log2-transformed read counts per million) in FAIRE-Seq (y-axis) and ATAC-Seq (x-axis) libraries from L3 discs (d), 24 h APF (e), and 44 h APF (f) wings. Each plot includes the union set of peak regions called at the given time point. (g and h) Percent of peaks residing at various genomic elements (g) and distribution of mean PhastCons scores (h) from ATAC-Seq (red) or FAIRE-Seq (blue) libraries, as well as from randomized peak regions (gray) and 250 bp regions covering the entire genome (white). ATAC-Seq and FAIRE-Seq datasets include peaks called at any time point. Additional data including Pearson correlation coefficients for all samples and replicates are provided in Supplemental Fig. 1.
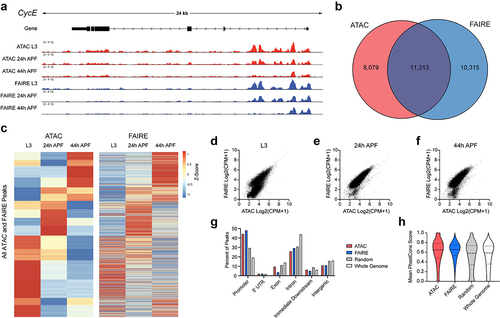
Figure 3. Wing disc dissociation is compatible with generation of high-quality ATAC-Seq libraries. (a) Table of quality metrics comparing ATAC-Seq libraries prepared from non-dissociated versus dissociated third larval instar (L3) wing discs. (b) ATAC-Seq reads at the cycE gene locus from dissociated (red) and non-dissociated (blue) L3 wing discs. Arrows on gene diagram indicate the direction of transcription. Y-axes for ATAC-Seq tracks: normalized read counts per million. (c) Venn diagram depicting the overlap between ATAC-Seq peaks called from dissociated (red) and non-dissociated (blue) L3 wing discs. (d) Scatter plot depicting the average signal intensity (log2-transformed counts per million) in dissociated (y-axis) and non-dissociated (x-axis) L3 wing discs for the union set of peak regions called in each condition. (e and f) Percent of peaks residing at various genomic elements (e) and distribution of mean PhastCons scores (F) from dissociated (red) or non-dissociated (blue) L3 wing disc ATAC-Seq libraries, as well as from randomized peak regions (gray) and 250 bp regions covering the entire genome (white). Additional data including Pearson correlation coefficients for dissociated vs. non-dissociated wings are provided in Supplemental Fig. 2.
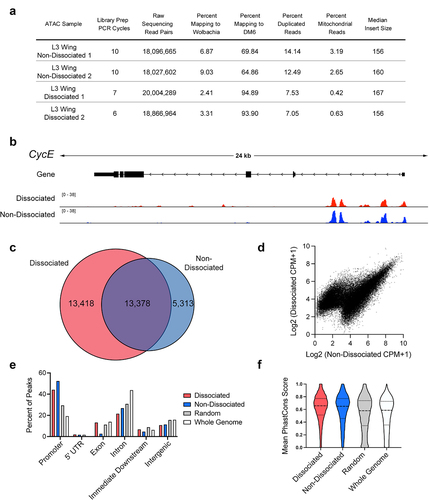
Figure 4. H3K27me3 CUT&RUN on dissociated pupal wings identifies stable domains similar to H3K27me3 ChIP-seq on larval wings. (a) Table of quality metrics comparing H3K27me3 CUT&RUN data prepared from 20 (red), 45 (blue), and 75 (green) dissociated 24 h APF wings and third larval instar dissociated wings (gold) to H3K27me3 third larval instar wing ChIP-seq (black). Downsampling of the CUT&RUN 20 wings and third larval instar samples was performed to account for the varying sequencing depth; number of peaks shown reflects downsampled data. (b) Heatmaps showing signal intensity of peaks called from CUT&RUN dissociated 24 h APF wings with differing sample input compared to peak signal intensity in third larval instar ChIP-seq. (c) Browser tracks showing H3K27me3 coverage at Antp, dsx, twi, and the bithorax complex containing Ubx, bxd, abd-A, and Abd-B loci comparing CUT&RUN wing samples with third larval instar wing disc ChIP-seq. Browser tracks were group autoscaled with the following scales: Antp locus (scale 0–39), dsx locus (scale 0–45), twi locus (scale 0–33), and Ubx locus (scale 0–37).