
Figures & data
Table 1. Crossing scheme for imaging experiments of the Drosophila brain. The line a contains RFP and GFP reporter genes under the control of UAS and LexAop sequences, respectively. Line B expresses LexA protein in an ALG-specific manner driven by Eaat1 promoter. The fly line C (of F1 generation) was generated by crossing the lines a and B (parents), and then it was crossed to the CG11000-GAL4 line (i.e. D) to produce F2 generation. Among the flies of F2 generation, the males and females that lacked balancer chromosomes but contain the complete components of the two binary systems UAS/GAL4 and LexA/LexAop were selected for brain dissection. The females (♀) of all crosses were virgin.
Table 2. Summary of the crosses and experimental genotypes for behavioral analyses. To generate the transgenic flies with expression of CG11000-RNAi in cell type-specific manner, the male flies of different GAL4 driver lines were crossed to the females harboring UAS-CG11000-RNAi in their genome (BDSC#: 51918). All the females (♀) for the above-mentioned crosses were virgin. Among the progenies of the above-described crosses, the flies with proper genotypes (harboring both cell type-specific expression of GAL4 and UAS-CG11000-RNAi) were selected based on the absence of balancer chromosomes (e.g. CyO, TM3, and TM6B). Three RNAi lines (BDSC# 51918, VDRC# v107504 and VDRC# v102061) have been used to confirm the functional role of deathstar gene in astrocytes.
Figure 1. Cell type identification of single cells in Drosophila optic lobe. (a) the list of molecular markers used in this study for cell type identification. (b) Classified single cells of D. melanogaster optic lobe based on their expression pattern for the markers. Red color denotes ‘expression,’ and black color denotes ‘no expression.’ A row Z-score was used to represent the expression level of each marker. (c) The principal component analysis (PCA) plot distinguishing the ALG single cells (red dots) from single cells of other cell types (labeled as non-ALG, green dots) based on their entire transcriptome profile. (d) Hierarchical clustering categorized ALG cells into four different clusters, all exhibiting distinct global transcriptome profile form other cell types. (e) Venn diagram illustrates the number of the genes upregulated in each ALG cluster. The table lists the common upregulated genes between all ALG clusters. Bold-face fonts represent the genes with cell type-specificity reports in previous studies. If the genes were previously attributed to a particular cell type cluster by Konstantinides et al. [Citation25], the features of the clusters are presented in the table. (f) Venn diagram illustrates the number of downregulated genes in each ALG cluster. The table lists the common downregulated genes in all ALG clusters. Also, the clustering information of Konstantinides et al. study is presented for each gene. (g) Sequence homology between CR40469 and CR34335 transcripts using ClustalW. Both sequences are shown in 5‘ → 3’ orientation. (h) Positive expression correlation of CR40469 and CR34335 genes in Drosophila optic lobe (n = 120,000 single cells). (i) Increased expression of deathstar gene in Eaat1-expressing (Eaat1+) cells in Drosophila optic lobe.
![Figure 1. Cell type identification of single cells in Drosophila optic lobe. (a) the list of molecular markers used in this study for cell type identification. (b) Classified single cells of D. melanogaster optic lobe based on their expression pattern for the markers. Red color denotes ‘expression,’ and black color denotes ‘no expression.’ A row Z-score was used to represent the expression level of each marker. (c) The principal component analysis (PCA) plot distinguishing the ALG single cells (red dots) from single cells of other cell types (labeled as non-ALG, green dots) based on their entire transcriptome profile. (d) Hierarchical clustering categorized ALG cells into four different clusters, all exhibiting distinct global transcriptome profile form other cell types. (e) Venn diagram illustrates the number of the genes upregulated in each ALG cluster. The table lists the common upregulated genes between all ALG clusters. Bold-face fonts represent the genes with cell type-specificity reports in previous studies. If the genes were previously attributed to a particular cell type cluster by Konstantinides et al. [Citation25], the features of the clusters are presented in the table. (f) Venn diagram illustrates the number of downregulated genes in each ALG cluster. The table lists the common downregulated genes in all ALG clusters. Also, the clustering information of Konstantinides et al. study is presented for each gene. (g) Sequence homology between CR40469 and CR34335 transcripts using ClustalW. Both sequences are shown in 5‘ → 3’ orientation. (h) Positive expression correlation of CR40469 and CR34335 genes in Drosophila optic lobe (n = 120,000 single cells). (i) Increased expression of deathstar gene in Eaat1-expressing (Eaat1+) cells in Drosophila optic lobe.](/cms/asset/c8143754-411c-4d97-a0c1-b8e61e9ba5e2/kfly_a_2368336_f0001_oc.jpg)
Figure 2. Positive expression correlation of deathstar with Eaat1. a) Heatmap analysis based on the Pearson correlation coefficient between deathstar and known molecular markers of Drosophila nervous system across sequenced single cells of Drosophila optic lobe (n = 120,000 cells). deathstar is co-clustered with the ALG markers including Eaat1 (dotted circle). b) Heatmap analysis based on the Pearson correlation coefficient between deathstar and known molecular markers of Drosophila nervous system across sequenced single cells of Drosophila mid-brain (n = 28,695). Two dotted circles in the heatmap point to the positive expression correlation of deathstar with Eaat1, among other markers. c-d) Correlation analysis of deathstar and Eaat1 expression level using a bulk RNA-seq data of developing whole brain from female D. melanogaster (n = 12 flies). e-f) Correlation analysis of deathstar and Eaat1 expression using a bulk RNA-seq data of developing whole brain of male D. melanogaster (n = 11 flies). g-j) Significant expression correlation between deathstar and Eaat1 genes across developmental time-points of female (g-h), and male (i-j) D. melanogaster, obtained from the bulk RNA-seq data analysis of developing whole brain of the flies.
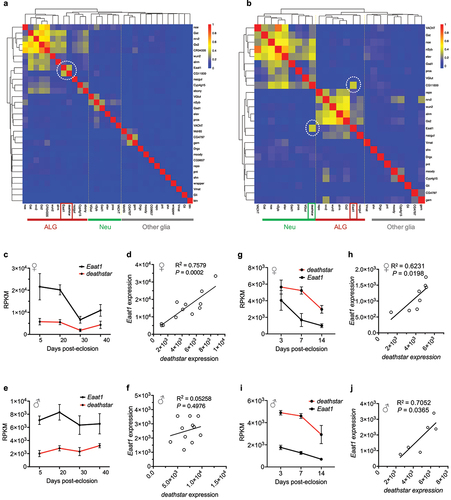
Figure 3. Coexpression of deathstar and Eaat1 in the Drosophila brain. a) Overlapping fluorescence signals correspond to the deathstar (RFP, red) and Eaat1 (GFP, green) expression, was shown in the midbrain of D. melanogaster (denoted as yellow dotted lines in the lower panel). Anti-repo antibody (α-repo) was used for labeling the glia in the Drosophila brain (blue). Scale bars = 50 µm. b) Results of the threshold function in ImageJ to differentiate real fluorescence signals from background for optimal quantification of overlapping fluorescent signals. Red signals denote deathstar (BDSC#: 91441), green signals denote Eaat1 (BDSC#: 52719), and blue signals denote repo expression. c-e) Quantification data of the overlapping signals between deathstar and Eaat1 (c), between deathstar and Repo (d), and between Eaat1 and Repo genes (e).
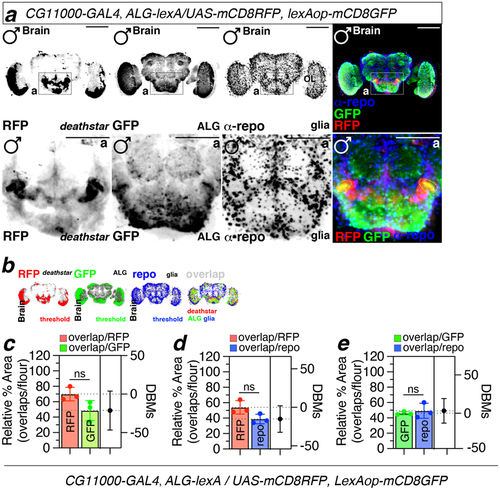
Figure 4. The effects of deathstar knock-down on normal development of D. melanogaster. a) In comparison with the control group, the majority of male progenies with deathstar knock-down did not develop into adults, indicated by significant reduction in eclosion rate (%). b) Deathstar knock-down in females did not show any developmental defects. Differences between the eclosion rates (%) of control group and the progenies with cell type-specific deathstar knock-down were not statistically significant (ns = nonsignificant). c-d) Eclosion rate of the progenies expressing an off-target RNAi, targeting the Drosophila CG15765 gene but not deathstar. The eclosion rate (%) was similar for all groups in both males and females.
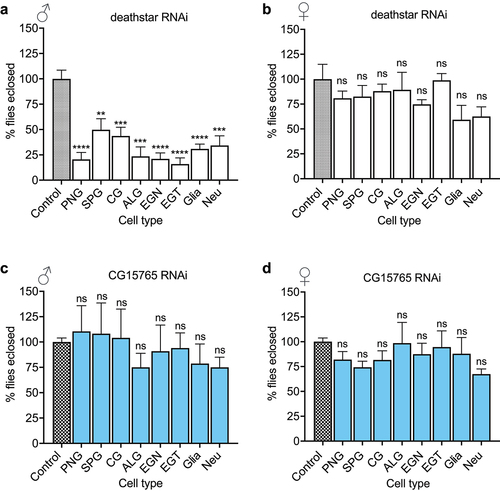
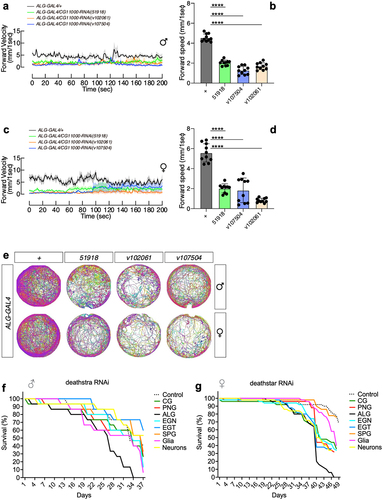
Figure 5. The effects of deathstar knock-down on the locomotion and lifespan of adult flies. a) Expression suppression of deathstar in astrocytes of male flies resulted in the decreased level of forward velocity per second, in a 200-second time course, in comparison with the control groups which do not express any RNAi (denoted as grey/black lines). b) Average velocity rate of the flies with suppressed deathstar expression in comparison with the control group (P-value <0.0001). c) Expression suppression of deathstar in astrocytes of female flies resulted in the decreased level of forward velocity per second, in a 200-second time course, in comparison with the control groups which lacked RNAi expression. d) Average velocity rate of the flies with suppressed deathstar expression in comparison with the control group (P-value <0.0001). e) Trajectory map analysis of the flies in the RNAi groups versus control groups, illustrating impeded locomotion activities in both male and female flies with suppressed expression level of deathstar using three different RNAi lines. f–g) ALG-specific reduction of lifespan in both male and female D. melanogaster, under expression suppression of deathstar gene.
Supplemental file S3_May 21 2024.docx
Download MS Word (1.5 MB)Supplemental file S4_May 21 2024.docx
Download MS Word (643.7 KB)Supplemental file S2_May 21 2024.xls
Download MS Excel (49 KB)Response to the comments_June 8 2024.docx
Download MS Word (17.9 KB)Supplemental file S1_May 21 2024.xls
Download MS Excel (53 KB)Data availability statement
The authors confirm that the data supporting the findings of this study are available within the article and its supplementary materials.