Figures & data
Figure 1. For figure legend, see next page.Figure 1 (See previous page). (A) Schematic of conventional patch clamp set-up showing the patch clamp pipette attached to the cell membrane. The cell is attached to the bottom of the dish and is viewed using a microscope. A ground electrode is positioned in the external solution and the internal electrode in the patch clamp pipette is attached to the amplifier headstage. Reproduced with permission from Brüggemann et al.42 © Wiley. Reproduced by permission of Bettina Loycke. Permission to reuse must be obtained from the rightsholder. (B) Schematic of a planar patch clamp set-up as used for the Port-a-Patch, Patchliner, SyncroPatch 96 and SyncroPatch 384PE. Here the cell is attached to the glass of the patch clamp chip. A ground electrode is positioned in the external solution and the internal electrode at the bottom of the planar chip is attached to the amplifier headstage. Reproduced with permission from Brüggemann et al.42 © Wiley. Reproduced by permission of Bettina Loycke. Permission to reuse must be obtained from the rightsholder. (C) The Patchliner chip. The planar glass layer which contains the patch clamp aperture is sandwiched between 2 plastic molds creating micro-fluidic channels. The pipette of the Patchliner is shown positioned in the channel for delivering external solution, cells and compounds. (D) Schematic of the Patchliner chip. The cell is shown positioned on the patch clamp aperture in the whole cell configuration. When solutions are added on the external side, the existing solution is pushed into the waste chamber and the external solution is completely exchanged. The waste chamber is emptied continuously using an external waste pump. (E) The Patchliner was used to repetitively activate nAChα7R expressed in HEK cells by nicotine on the Patchliner. The solutions were stacked inside the pipette of the Patchliner to minimise exposure time. Shown are 8 consecutive applications of 100 µM nicotine. Peak amplitude is consistent over all 8 applications. Inset shows nAChα7R activation of the first application expanded. Reproduced with permission from Obergrussberger et al.17 © Wiley. Reproduced by permission of Paulette Goldweb. Permission to reuse must be obtained from the rightsholder. (F) Current traces of TRPV3 expressed in HEK cells when activated by heated solution. External solution was heated inside the pipette of the Patchliner to the temperature shown and applied to the cell. Currents started to activate at ≥ 38°C. (Reproduced with permission from Stoelzle et al.14 © Sonja Stoelzle-Feix, reproduced by permission of Sonja Stoelzle-Feix. Permission to reuse must be obtained from the rightsholder.
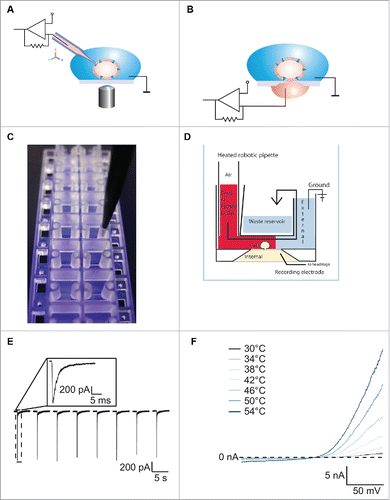
Table 1. Comparison of automated patch clamp devices available on the market. Information contained within the table was collected from relevant company websites: www.nanion.de; www.moleculardevices.com; www.sophion.com and www.fluxionbio.com. * 16 amplifier channels and a multiplexer are used. ** 10 ms for Fast Perfusion Kit for the Port-a-Patch and 100 ms for standard External Perfusion System. *** rough estimates from the manufacturers and vendors, depending on cells, protocols etc.
Figure 2. (A) Current-voltage plot of an average of 4 iPS cardiac cells (Cellectis) recorded on one run of the Patchliner. The currents were normalized to the maximum peak amplitude. The inset shows raw traces from an exemplar cell in response to voltage steps from −80 mV to 40 mV. Currents started to activate about −50 mV and peak response was elicited at around −20 mV. Bi Current responses of an iPS cardiac cell to a voltage protocol to −20 mV from a holding potential of −120 mV in control conditions and in the presence of 100 µM tetracaine. Tetracaine almost completely blocked the current response at this concentration, an effect that was completely reversible upon washout (trace not shown). Bii Action potentials were elicited in the current clamp mode using a 1 ms depolarizing current pulse. A holding current of −185 pA was used to maintain a baseline voltage of −96 mV. The action potential in control conditions is shown in black. The sodium channel blocker, tetracaine, at 100 µM was applied and this inhibited the action potentials (blue). The effect could be reversed upon washout (gray). (C) Current-voltage relationship of an average of 54 iPS neurons (CDI) recorded on the Patchliner. The inset shows raw traces from an exemplary cell showing NaV and KV currents present in the cell. Fast, transient inward Nav currents started to activate at about −40 mV, and peak currents were elicited at −10 mV or −20 mV. (D) Activation of currents in iPS neurons (CDI) by the ligand GABA (30 µM). GABA was applied for approximately 600 ms before washout with external solution using a stacked solutions approach. Cells were held at a constant holding potential of −70 mV. (E) Action potential elicited from an iPS neuron (CDI) recorded on the Patchliner. Action potentials were elicited using a 2ms depolarizing pulse. Panels (C-E) reproduced with permission from Haythornthwaite et al.28 © SAGE. Reproduced by permission of Michelle Binur. Permission to reuse must be obtained from the rightsholder.
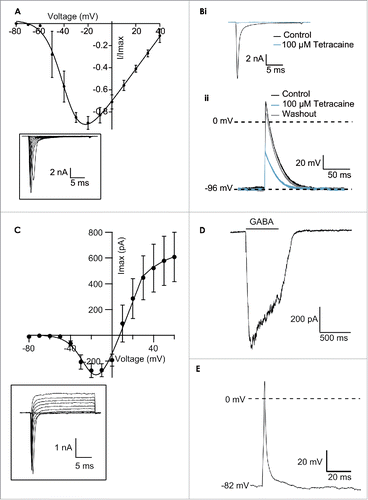
Figure 3. Screenshot of PatchControl 384, the software for the SyncroPatch 384PE, during a recording of 6 cardiac ion channels expressed in different cell lines. Four columns of the patch clamp chip (64 wells) received one cell line expressing either hERG (HEK), KV4.3 (CHO), KV7.1 (CHO), Kir2.1 (HEK), NaV1.5 (CHO) or CaV1.2 (CHO). All cell lines were provided by ChanTest (a Charles River Company). A voltage protocol was designed to activate all channels simultaneously, shown at the top of the figure. The first step to 0 mV (1) was used to activate NaV1.5 and CaV1.2, the second part of the protocol to 60 mV followed by a step to −40 mV (2) was used to activate KV4.3, hERG and KV7.1 and the final ramp (3) was used to activate Kir2.1. The columns are scaled individually to expand the relevant current and an example is shown at the top of each set of columns.
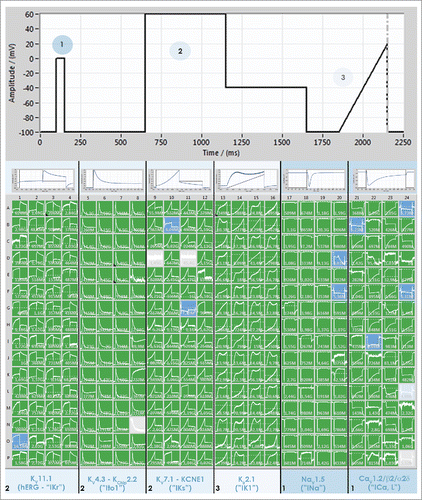
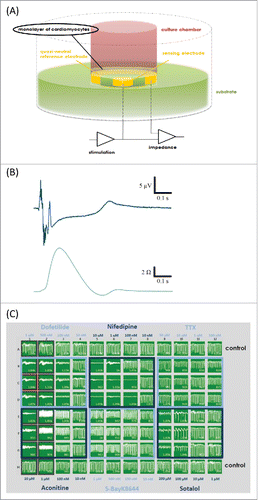
Figure 4. (A) Schematic setup of impedance measurement electrodes in the CardioExcyte 96 (Nanion Technologies). (B) The CE96 is capable of performing impedance and EFP recordings in combination. Top trace shows an EFP recording which represents the electrophysiological activity, the bottom trace shows the corresponding impedance trace which represents the contractility of the beating network. Note that the spikes in the beginning of the EFP trace are due to the fact that one recording electrode is used with which the electrical activity of the complete cardiomyocyte network is detected, translocation of the signal thus results in slightly shifted Na spikes. (C) 96-well view of an exemplary experimental layout in the impedance mode. Different concentrations of compounds were tested on Cor.4U cardiomyocytes (Axiogenesis). The compound-induced effects on the beat rate, amplitude or beat irregularity (arrhythmia), among other parameters, can be viewed online during the experiment. Panels (A and C) reproduced with permission from Doerr et al.32 © SAGE. Reproduced by permission of Michelle Binur. Permission to reuse must be obtained from the rightsholder.