Figures & data
Figure 1. The serum cholesterol levels (A) and body weight (B) of the rabbits in the control and HC groups. n = 18. **p < 0.01, HC vs control.
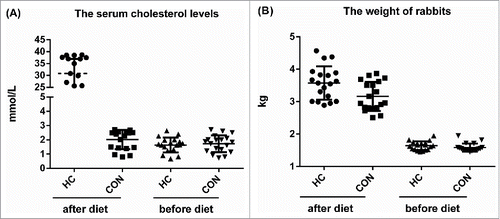
Figure 2. BKCa channel currents recorded on SOSMCS in rabbits from the control and HC groups. (A) Representative potassium currents recorded in SOSMCs from control group in the presence or absence of 10 μM paxilline. (B) BKCa currents recorded in primarily cultured SOSMCs from rabbits in the control group and HC group (the voltage protocol shown above). (C) I-V relationships of BKCa current density in SOSMCs from the control group (n = 8) and HC group (n = 8). *p < 0.05, ** p < 0.01.
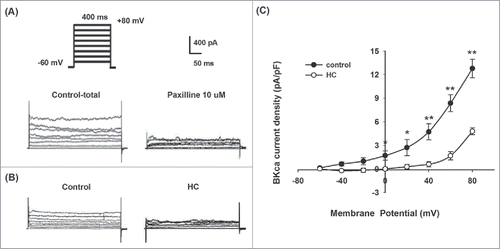
Figure 3. The protein expression of BKCa channels in SOSMCs in the control and HC groups. (A) Representative immunohistochemically staining of α-SMC, BKCa α- subunits, and BKCa β1-subunits in SOSMCs. Magnification, ×200. (B) Western blot analysis showing the total protein expression of BKCa α-. and β1-.subunits. (C) The protein expression of Tyr-phosphorylated BKCa α-. and β1-.subunits. The proteins were immunoprecipitated with antibodies against phosphorylated BKCa α- and β1-subunits and detected with Western blot. CON: SOSMCs from control group rabbits; HC: SOSMCs from hypercholesterolemia group rabbits; Microglial cells used for negative control. n = 5. **p < 0.01, HC vs control.
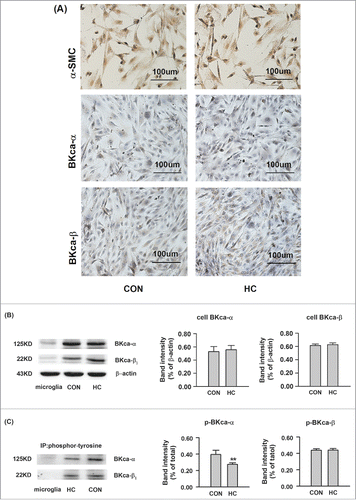
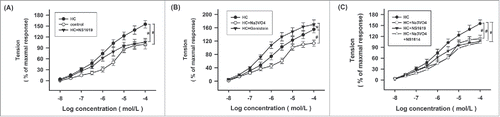
Figure 4. Effects of NS1619, Na3VO4, and Genistein on ACh-induced contraction of the SO rings in HC rabbits. (A) The concentration-response curve of ACh-induced contraction of the SO rings in the control, HC and HC+NS1619 groups. SO rings were pretreated with NS1619 (30 μM) for 15minutes. (B) The concentration-response curve of ACh-induced contraction of the SO rings in the HC, HC + Na3VO4, and HC + Genistein groups. SO rings were pretreated with Na3VO4 (100 μM) for 30 min, or Genistein (10 μM) for 30 min. (C) The concentration-response curve of ACh-induced contraction of the SO rings in the HC, HC + Na3VO4, HC + NS1619, and HC + Na3VO4 + NS1619 groups. SO rings were pretreated with Na3VO4 (100 μM) for 30 min, or/and NS1619 (30 μM) for 30 min. n = 8. *p < 0.05, # p < 0.01.