
Figures & data
Figure 1. Allyl isothiocyanate (AITC) increases [Ca2±]I and shortening in CMs. Original traces demonstrating the effect of AITC (100 μmol/L) on steady-state sarcomere length (µm; panel A) and [Ca2+]i (340/380 ratio; panel B) in an individual mouse ventricular myocyte. AITC was added where indicated on the figure. Exploded views depicting the dose-dependent changes in sarcomere length and [Ca2+]i (panels C and D, respectively) before (control) and after addition of AITC (1–300 µmol/L) to single ventricular myocyte. AITC was added to the bath in a cumulative fashion. n = 20 cells from 6 hearts.
![Figure 1. Allyl isothiocyanate (AITC) increases [Ca2±]I and shortening in CMs. Original traces demonstrating the effect of AITC (100 μmol/L) on steady-state sarcomere length (µm; panel A) and [Ca2+]i (340/380 ratio; panel B) in an individual mouse ventricular myocyte. AITC was added where indicated on the figure. Exploded views depicting the dose-dependent changes in sarcomere length and [Ca2+]i (panels C and D, respectively) before (control) and after addition of AITC (1–300 µmol/L) to single ventricular myocyte. AITC was added to the bath in a cumulative fashion. n = 20 cells from 6 hearts.](/cms/asset/3ec797d5-8a31-4cdd-a743-571798689e3a/kchl_a_1365206_f0001_b.gif)
Table 1. Comparison of AITC- and isoproterenol (ISO)-induced changes in CM [Ca2±]i and contractile function. Data are expressed as mean ± SEM. * P < 0.05 compared with untreated control (ctrl).
Figure 2. AITC increases fractional shortening, maximum velocity of shortening and maximum velocity of relengthening in CMs. Overlays of individual cell shortening and relengthening events illustrating the dose-dependent effects of AITC (1–300 μmol/L) on fractional shortening are depicted in panel A. Representative overlays assessing changes in sarcomere length normalized to peak height (set at 100%) and aligned at initiation of stimulus or at peak shortening to illustrate dose-dependent changes in timing of shortening and relengthening are depicted in panels C and E, respectively. Summarized data for panels A (fractional shortening), C (maximal velocity of shortening) and E (maximal velocity of relengthening) are depicted in panels B, D and F, respectively. Results are expressed as percent of steady-state baseline control (Ctrl) value set at 100%. Changes in fractional shortening were measured as percent of sarcomere length. Changes in velocity were measured in micrometers/sec. * P < 0.05 compared with Ctrl. n = 20 cells from 6 hearts.
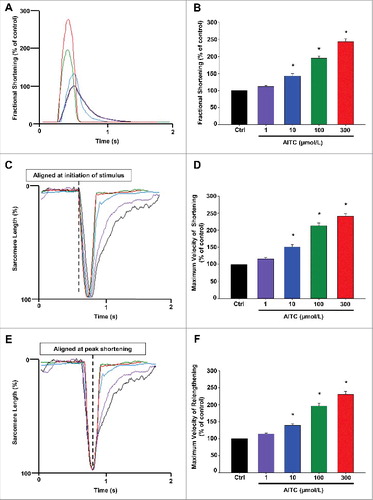
Figure 3. AITC increases peak [Ca2±]I and accelerates time to peak [Ca2±]I and the rate of [Ca2±]I decay in CMs. Overlays illustrating the dose-dependent effects of AITC (1–300 μmol/L) on peak [Ca2+]i are depicted in panel A. Representative overlays assessing dose-dependent changes in [Ca2+]i peak amplitude normalized to peak height (set at 100%) to illustrate changes in time to peak [Ca2+]i and the time of [Ca2+]i decay are depicted in panels C and E, respectively. Summarized data for panels A ([Ca2+]i peak amplitude), C (time to peak [Ca2+]i) and E ([Ca2+]i decay) are depicted in panels B, D and F, respectively. Results are expressed as percent of steady-state baseline control (Ctrl) value set at 100%. Changes in peak [Ca2+]i are measured as the change in the 340/380 ratio. Changes in timing are measured in milliseconds. Individual traces were smoothed using the Savitzky-Golay filter to increase the signal-to-noise ratio. * P < 0.05 compared with Ctrl. n = 20 cells from 6 hearts.
![Figure 3. AITC increases peak [Ca2±]I and accelerates time to peak [Ca2±]I and the rate of [Ca2±]I decay in CMs. Overlays illustrating the dose-dependent effects of AITC (1–300 μmol/L) on peak [Ca2+]i are depicted in panel A. Representative overlays assessing dose-dependent changes in [Ca2+]i peak amplitude normalized to peak height (set at 100%) to illustrate changes in time to peak [Ca2+]i and the time of [Ca2+]i decay are depicted in panels C and E, respectively. Summarized data for panels A ([Ca2+]i peak amplitude), C (time to peak [Ca2+]i) and E ([Ca2+]i decay) are depicted in panels B, D and F, respectively. Results are expressed as percent of steady-state baseline control (Ctrl) value set at 100%. Changes in peak [Ca2+]i are measured as the change in the 340/380 ratio. Changes in timing are measured in milliseconds. Individual traces were smoothed using the Savitzky-Golay filter to increase the signal-to-noise ratio. * P < 0.05 compared with Ctrl. n = 20 cells from 6 hearts.](/cms/asset/547ede52-35d3-4d58-a064-7f9d33941ff2/kchl_a_1365206_f0003_oc.jpg)
Figure 4. AITC has no effect on [Ca2±]I and shortening in CMs obtained from TRPA1 null mice. Original traces demonstrating the lack of effect of AITC (100 μmol/L) on steady-state sarcomere length (µm; panel A) and [Ca2+]i (340/380 ratio; panel B) in an individual mouse ventricular myocyte obtained from TRPA1 null mice (TRPA1−/−). AITC was added where indicated on the figure. Exploded views of changes in sarcomere length and [Ca2+]i before and after addition of AITC are depicted in panels C-F. n = 8 cells from 4 hearts.
![Figure 4. AITC has no effect on [Ca2±]I and shortening in CMs obtained from TRPA1 null mice. Original traces demonstrating the lack of effect of AITC (100 μmol/L) on steady-state sarcomere length (µm; panel A) and [Ca2+]i (340/380 ratio; panel B) in an individual mouse ventricular myocyte obtained from TRPA1 null mice (TRPA1−/−). AITC was added where indicated on the figure. Exploded views of changes in sarcomere length and [Ca2+]i before and after addition of AITC are depicted in panels C-F. n = 8 cells from 4 hearts.](/cms/asset/5f278342-f09e-4dab-b539-4345c05f41a4/kchl_a_1365206_f0004_b.gif)
Figure 5. TRPA1 stimulation does not signal through the cAMP/Protein Kinase A (PKA) pathway in CMs. Summarized data demonstrating the effects of ISO (1–100 nmol/L) and AITC (1–300 µmol/L) on cAMP production in CMs obtained from WT mice are depicted in panels A and B, respectively. Results are expressed as total cAMP production (pmol/mL; n = CMs isolated from 5 separate hearts repeated in triplicate). Summarized data demonstrating the effects of AITC (100 µmol/L) or ISO (10 nmol/L) in the presence or absence of PKA inhibitor, PKI 14–22 (1–100 nmol/L), on PKA activity is shown in panel C (n = CMs isolated from 3 separate hearts repeated in triplicate). The dose-dependent effects of PKI 14–22 treatment following isoproterenol-induced increases in contractile function are shown in the subfigure on the right side of panel C (n = 6 CMs from 3 hearts). * P < 0.05 compared with untreated control value. # P < 0.05 compared with isoproterenol-treated CMs.
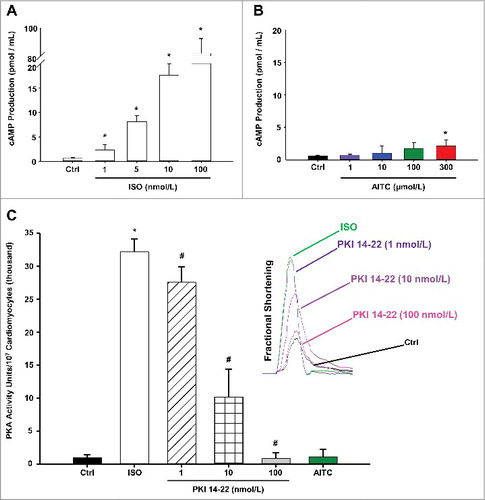
Figure 6. AITC-induced increases in contractile function and [Ca2±]i occur independently of PKA in CMs. Overlays of fractional shortening and [Ca2+]i peak amplitudes in electrically-paced CMs illustrating the effects of AITC (100 µmol/L) in the presence and absence of PKI 14–22 (100 nmol/L) are depicted in panels A and B, respectively. Summarized data for parameters measuring contractile function are depicted in panels C (fractional shortening), E (maximum velocity of shortening) and G (maximum velocity of relengthening). Summarized data analyzing [Ca2+]i dynamics are depicted in panels D ([Ca2+]i peak amplitude), F (time to peak [Ca2+]i) and H ([Ca2+]i decay). Results are expressed as percent of steady-state baseline control (Ctrl) value set at 100%. Individual [Ca2+]i traces were smoothed using the Savitzky-Golay filter to increase the signal-to-noise ratio. N.S. = not statistically significant. * P < 0.05 compared with Ctrl. n = 18 cells from 6 hearts.
![Figure 6. AITC-induced increases in contractile function and [Ca2±]i occur independently of PKA in CMs. Overlays of fractional shortening and [Ca2+]i peak amplitudes in electrically-paced CMs illustrating the effects of AITC (100 µmol/L) in the presence and absence of PKI 14–22 (100 nmol/L) are depicted in panels A and B, respectively. Summarized data for parameters measuring contractile function are depicted in panels C (fractional shortening), E (maximum velocity of shortening) and G (maximum velocity of relengthening). Summarized data analyzing [Ca2+]i dynamics are depicted in panels D ([Ca2+]i peak amplitude), F (time to peak [Ca2+]i) and H ([Ca2+]i decay). Results are expressed as percent of steady-state baseline control (Ctrl) value set at 100%. Individual [Ca2+]i traces were smoothed using the Savitzky-Golay filter to increase the signal-to-noise ratio. N.S. = not statistically significant. * P < 0.05 compared with Ctrl. n = 18 cells from 6 hearts.](/cms/asset/e02bd59a-494b-49fd-8d19-83df773cdf90/kchl_a_1365206_f0006_oc.jpg)
Figure 7. AITC-induced phosphorylation of CaMKII at threonine 286 occurs in a time- and TRPA1-dependent manner in CMs. Representative immunoblots demonstrating the effect of AITC (100 µmol/L) on CaMKII phosphorylation at threonine 286 (pCaMKII-t286) at 0–5 minutes in CMs obtained from WT mice are depicted in panel A. All samples were lysed at the indicated time points (mins). Summarized data are shown as the % of the untreated mean control value (pCaMKII-t286/total protein) in panel B (n = CMs obtained from 5 separate hearts). Representative immunoblots demonstrating the effects of AITC (100 µmol/L) on CaMKII phosphorylation in the presence (+) and absence (−) of KN93 (10 µmol/L) is shown in panel C. Samples from WT and TRPA1−/− were either treated with AITC or pretreated with KN93 for 10 minutes before AITC administration. All samples were lysed 5 minutes following treatment of AITC. Summarized data are expressed as the percent of the untreated WT mean control value in panel D (n = CMs isolated from 5 separate hearts). GAPDH was probed as the loading control. N.S. = not statistically significant. P.L. = protein ladder. * P < 0.05 compared with the WT mean control value. # P < 0.05 compared with the AITC-treated WT CMs.
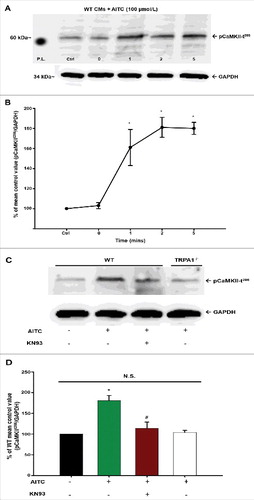
Figure 8. TRPA1 stimulation modulates contractile function and [Ca2±]i through a CaMKII-dependent mechanism in CMs. Overlays of fractional shortening and [Ca2+]i peak amplitudes in electrically-paced CMs illustrating the effects of AITC (100 µmol/L) in the presence and absence of KN93 (1–10 µmol/L) are depicted in panels A and B, respectively. Summarized data for parameters measuring contractile function are depicted in panels C (fractional shortening), E (maximum velocity of shortening) and G (maximum velocity of relengthening). Summarized data analyzing [Ca2+]i dynamics are depicted in panels D ([Ca2+]i peak amplitude), F (time to peak [Ca2+]i) and H ([Ca2+]i decay). Results are expressed as percent of steady-state baseline control (Ctrl) value set at 100%. Individual [Ca2+]i traces were smoothed using the Savitzky-Golay filter to increase the signal-to-noise ratio. * P < 0.05 compared with Ctrl. # P < 0.05 compared with AITC-treated cells. n = 15 cells from 5 hearts.
![Figure 8. TRPA1 stimulation modulates contractile function and [Ca2±]i through a CaMKII-dependent mechanism in CMs. Overlays of fractional shortening and [Ca2+]i peak amplitudes in electrically-paced CMs illustrating the effects of AITC (100 µmol/L) in the presence and absence of KN93 (1–10 µmol/L) are depicted in panels A and B, respectively. Summarized data for parameters measuring contractile function are depicted in panels C (fractional shortening), E (maximum velocity of shortening) and G (maximum velocity of relengthening). Summarized data analyzing [Ca2+]i dynamics are depicted in panels D ([Ca2+]i peak amplitude), F (time to peak [Ca2+]i) and H ([Ca2+]i decay). Results are expressed as percent of steady-state baseline control (Ctrl) value set at 100%. Individual [Ca2+]i traces were smoothed using the Savitzky-Golay filter to increase the signal-to-noise ratio. * P < 0.05 compared with Ctrl. # P < 0.05 compared with AITC-treated cells. n = 15 cells from 5 hearts.](/cms/asset/1fe0a323-b1f8-428f-bd65-37b1acd683f1/kchl_a_1365206_f0008_oc.jpg)