Figures & data
Table 1. List of antibodies used for immunohistochemistry
Figure 1. Immunohistochemical staining approach to identify the CGRP+ SDH region and study GluN2 subunit distribution. Left) Laminae I and IIo of the superficial dorsal horn (SDH) are immunopositive for punctate CGRP (red) staining, labeling the relatively nociceptive-specific marginal region of the SDH. Middle) Co-labeling with an antibody against a specific GluN2 subunit (GluN2B here, yellow) is performed on the same spinal sections stained for CGRP. Right) Overlay of CGRP and GluN2B immunostaining. The marginal SDH that is CGRP-positive is outlined (white line), and then GluN2 subunit immunoreactivity is described and quantified in this CGRP+ SDH region in comparison to the remaining deep dorsal horn (DDH) laminae. Scale bar: 200 μm
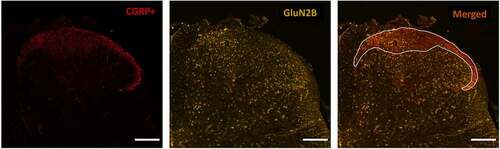
Figure 2. Immunolabelling of GluN2A, GluN2B and GluN2D subunits in the SDH and DDH of male and female rats. The CGRP+ marginal region of the SDH as well as the remaining DDH was outlined as described in . For immunoreactive quantification in subsequent figures, SDH and DDH staining (per area) were normalized to background (BG) signal in a boxed region of the immuno-negative dorsal column. A, bottom) Representative confocal images (20x objective) illustrating the fluorescence staining patterns for GluN2A (left), GluN2B (middle) and GluN2D (right) in male juvenile rats. Scale bar: 200 μm. A, top) Higher magnification insets illustrating the distribution of immunoreactivity in the marginal SDH for all three GluN2 subtypes. GluN2A immunoreactivity is uniformly distributed across the neuropil of the SDH and DDH laminae, while GluN2B and GluN2D signal is also widespread but with differential expression in SDH versus DDH laminae, with staining of both neuropil and cell bodies. Scale bar: 50 µm. B, bottom) Representative confocal images (20x objective) illustrating the fluorescence staining patterns for GluN2A (left), GluN2B (middle) and GluN2D (right) in female juvenile rats. Scale bar: 200 μm. A, top) Higher magnification insets illustrating the distribution of immunoreactivity in the marginal SDH for all three GluN2 subtypes. GluN2A immunoreactivity is distributed mainly in the neuropil of the SDH and DDH laminae, while GluN2B and GluN2D signal demonstrates staining of both neuropil and cell bodies in the SDH and DDH. Scale bar: 50 µm
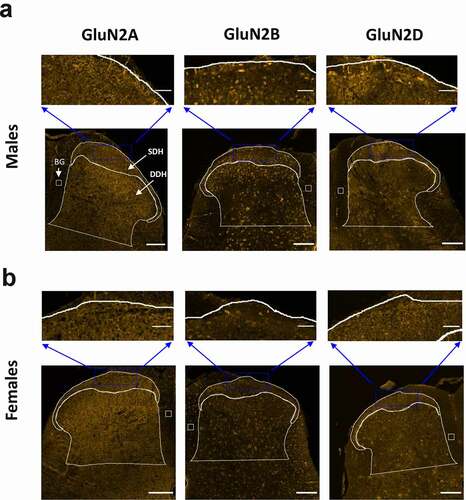
Figure 3. Relative expression of GluN2A, GluN2B and GluN2D in the SDH versus the DDH of males and female rats. Optical density of a given GluN2 signal per area for the SDH as well as for the DDH was normalized to background optical density per area (see box in ). Average SDH and DDH measures were derived from multiple spinal sections for each animal (shown as individual data points), followed by a paired comparison between the normalized SDH and DDH for each GluN2 subtype. (a) In males, there is significantly higher expression in the SDH (dark blue bars) versus the DDH (light blue bars) for all the three GluN2 subunits, but with more pronounced differential expression for GluN2B (middle) and GluN2D (right). (b) In females, the GluN2B isoform (middle) is the only GluN2 subunit that exhibits significantly greater expression in the SDH (dark purple) versus the DDH (light purple). *p < 0.05
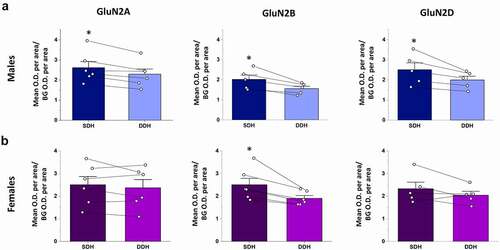
Figure 4. The GluN2B, but not GluN2A or GluN2D, isoform is preferentially expressed in the medial versus the lateral region of the SDH in male rats. (a) Representative confocal images (20x objective) illustrating the immunofluorescence for GluN2A (left), GluN2B (middle), and GluN2D (left). For each isoform, the OD per area was quantified in selected oval regions positioned within the medial, central and lateral regions of the CGRP+ SDH, as shown. There was a visible increase in intensity and distribution of fluorescent puncta in the medial SDH compared to the lateral SDH for GluN2B but not GluN2A or GluN2D. Scale bar: 200 µm. (b) Statistical analysis showing the mean medial vs lateral OD ratio for GluN2A, GluN2B and GluN2D. The medial/lateral OD ratio was significantly higher for GluN2B compared to both GluN2A and GluN2D. *p < 0.05
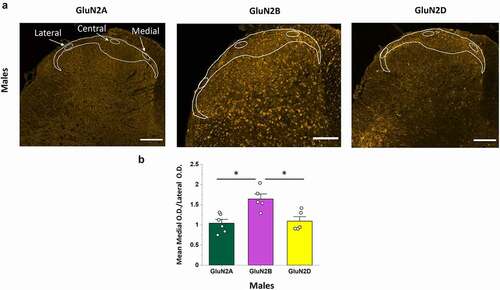
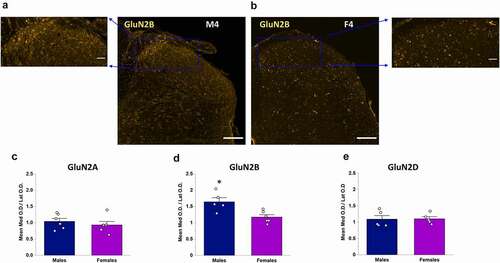
Figure 5. Comparison of the medial vs lateral OD ratio of GluN2 subunit isoforms between males and female rats. A, B) Representative confocal images showing GluN2B immunofluorescence in a male (a) and female rat (b), Scale bar: 200 μm, as well as higher magnification insets of the SDH for both male (top left) and female (top right), Scale bar: 50 μm. GluN2B signal is preferentially localized to the medial portion of the SDH in males (a) but not females (b). (c–e) Quantitative statistical analysis of the mean medial vs lateral OD ratio for GluN2A (c), GluN2B (d) and GluN2D (e) in males versus females. The medial/lateral ratio for GluN2B was significantly greater in males compared to females (d), while the medial/lateral ratio was not significantly different between males and females and near values of 1 for both GluN2A (c) and GluN2D (e). *p < 0.05