Figures & data
Figure 1. KCNE2 forms complexes with Testin. (a,b) Summary of yeast two-hybrid results indicating the region of Testin (residues 297–369, in yellow) (PREY) common to all clones interacting with the KCNE2 C-terminal domain (residues 66–123, in pink) (BAIT). SID = Selected Interacting Domain
(c). Transmembrane topology of KCNE2 showing the intracellular portion used for bait in yeast two-hybrid (pink). (d) Representative western immunoblot (IB) (from n = 2) confirming physical association by co-immunoprecipitation (IP) of DDK-tagged Testin with HA-tagged KCNE2 alongside IP controls; lysate controls are shown on right.
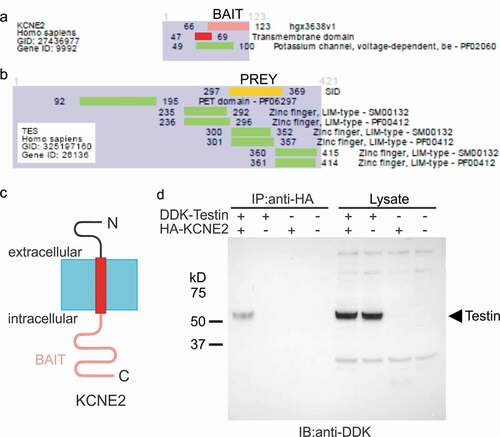
Figure 2. Testin modulates KCNE2 effects on Kv1.5
All error bars indicate SEM. (a) Exemplar traces showing whole-cell patch-clamp recordings from CHO cells transfected with the subunit combinations shown. Dotted line indicates zero current level. Upper inset shows the voltage protocol.(b) Mean current density for currents expressed by subunit combinations indicated. Kv1.5, n = 13; Kv1.5 + Testin, n = 14; Kv1.5 + KCNE2, n = 15; Kv1.5 + Testin + KCNE2, n = 19.(c) Mean G/Gmax calculated from tail current for cells as in B.(d) Mean activation rate quantified as fast (Tfast) and slow (Tslow) components from a double exponential fit, for cells as in B. * P < 0.05; ** P < 0.01 for Kv1.5 + KCNE2 versus other groups; # P < 0.05 for Kv1.5 + KCNE2 versus Kv1.5 + KCNE2 + Testin. (e) Relative amplitude of the slow component of activation for cells as in B. Mean deactivation rate quantified as T of a single exponential fit, for cells as in B.* P < 0.05 versus other groups.
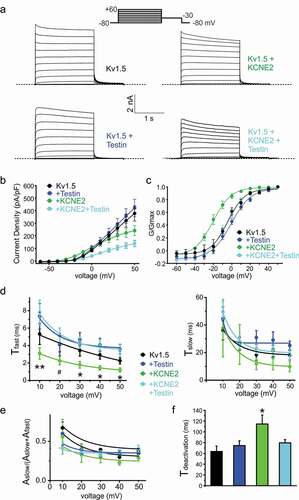
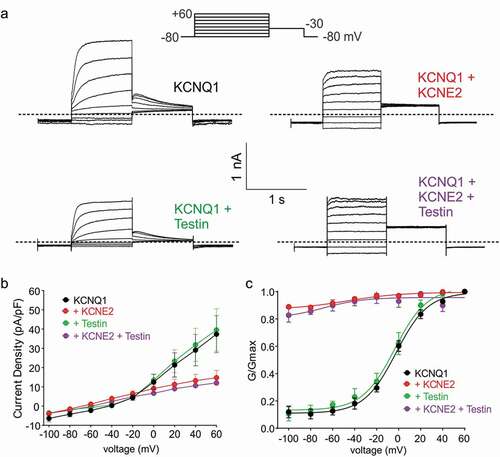
Figure 3. Testin does not alter KCNE2 modulation of KCNQ1
All error bars indicate SEM. (a) Exemplar traces showing whole-cell patch-clamp recordings from CHO cells transfected with the subunit combinations shown. Dotted line indicates zero current level. Upper inset shows the voltage protocol. (b) Mean current density for currents expressed by subunit combinations indicated. KCNQ1, n = 14; KCNQ1 + Testin, n = 12; KCNQ1 + KCNE2, n = 12; KCNQ1 + Testin + KCNE2, n = 13.(c) Mean G/Gmax calculated from tail current for cells as in B.