Figures & data
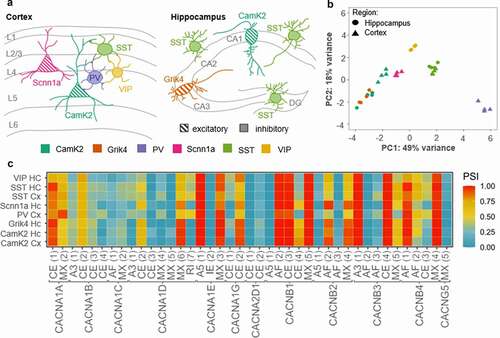
Figure 1. VGCCs as voltage sensors
As known from the skeletal muscle, also in neurons VGCCs have been shown to colocalize with ryanodine receptors (RyR) in the endoplasmic reticulum and trigger RyR-mediated Ca2+release from intracellular stores. Importantly, the RyR opening, especially of RyR isoform 1, was shown to be independent of the ionic activity of the VGCCs but rather require the conformational change of the voltage-sensing transmembrane helices of the VGCC pore induced by membrane depolarization, a process called voltage-induced calcium release. Additional interaction partners like voltage-gated (Kv) or Ca2+-activated (KCa) potassium channel and membrane-binding proteins, junctophilins, might complement and stabilize this functional complex.
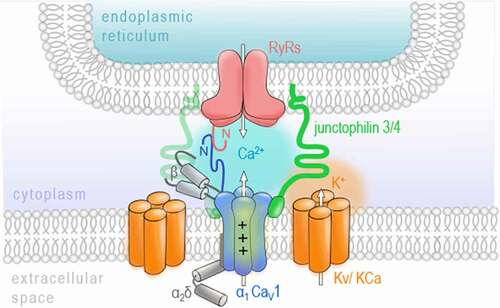
Figure 2. VGCCs participate in gene regulation
Besides Ca2+-dependent signaling cascades activating NFAT, CREB, or DREAM, VGCC β4 subunits (A, left) and α1 C-terminal domains (B, right) also act as transcription factors. A) β4 splice variants interact with proteins of the epigenetic machinery such as HP1s or the B56δ regulatory subunit of protein phosphatases-2A (PP2A) and translocate to the nucleus with a rank order of ᵝ4b > ᵝ4a > ᵝ4e. B) CCAT and ɑ1ACT are fragments directly derived from the carboxyl-terminus of the pore-forming α1 subunit of CaV1.2 and CaV2.1 channels, respectively. Their expression via an internal ribosomal entry site (IRES) or an unknown exonic promoter is controversially discussed. They have been shown to translocate to the nucleus and regulate gene activity associated with neurodevelopment and synaptic transmission. Modelled after Barbado et al. 2009Citation32 and Tadmouri et al. 2012Citation57.
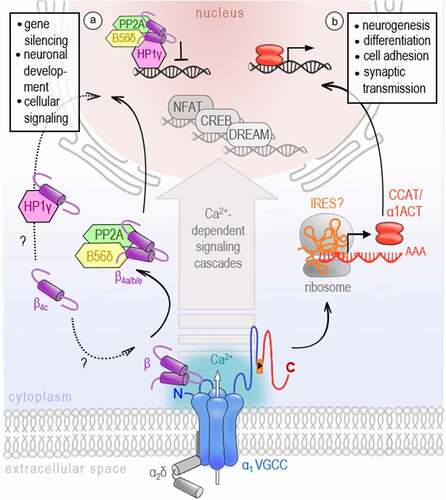
Figure 3. Channel-independent functions of the auxiliary ɑ2 δ subunit
A) Excitatory and inhibitory synaptogenesis: As interaction partners of thrombospondins, ɑ2δs were shown to foster glutamatergic synapse formation. Further, ɑ2δ subunits participate in GABAergic synaptogenesis. B) Transsynaptic signaling: ɑ2δ subunits interact with α-neurexin, which is involved in the formation of transsynaptic complexes supporting synapse specification, establishment, maturation, and plasticity. C) Competition of other interaction partners, like the large conductance (big) potassium (BK) ɑ subunit, for ɑ2δ.
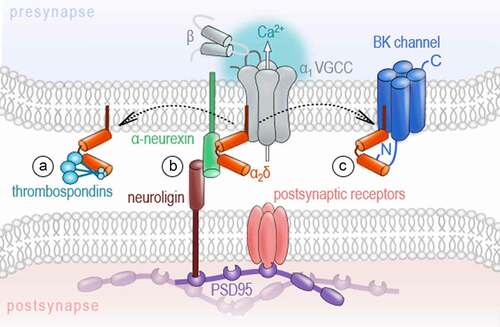
Figure 4. VGCC genes are spliced differently across neuronal cell types
A) Schematic overview representing different neuronal cell populations included in the RNA sequencing data (data is publicly available; accession code: GSE133291[Citation110]). The scheme was adapted from Furlanis and colleagues. The color-code for the cell types is used in B. CamK2= Ca2+/calmodulin-dependent protein kinase II; Grik4= glutamate receptor, ionotropic, kainite 4; PV= parvalbumin; Scnn1a=α subunit of the epithelial sodium channel ENaC; SSTsomatostatin; VIP- vasoactive intestinal peptide. B) The principal component analysis (PCA) of the gene expression demonstrates a differential regulation of VGCC genes across excitatory and inhibitory neuronal cell types. Especially, the cluster of PV interneurons localizes with asignificant gap to other neuron types on principal component 1, which explains roughly fifty percent of the observed variance. Data analysis: The fastq-files were mapped to the mm10 reference genome using STAR[Citation117]. The PCA was performed with DESeq2 in R[Citation118,Citation119] and plotted with ggplot2[Citation120]. C) Heatmap of alternatively spliced transcripts of VGCC genes. We have analyzed the occurrence of the following splice events: cassette exon (CE), mutually exclusive exon (MX), retained intron (RI), alternative 5’ splice-site (A5), alternative 3’ splice-site (A3) and alternative first exon (AF), schematically shown in the lower part of C. Only those events that show a significant variance between the samples (ANOVA p-value < 0.01) were included. Overall, a difference between the PV neurons and the remaining samples in the splice patterns for the VGCC genes can be observed (e.g. CACNA1A MX(2), CACNB1 CE(4) or CANB3 MX (5)). Since the exon numbering depends on the transcript variant of a respective gene, the exact position for the splice variants (for instance, the start and end coordinates of the included exon) of the heatmap are listed here: CACNA1A: CE (1) chr8:84601756−84601821, MX (2) chr8:84614695−84614791, CACNA1B: A3 (1) chr2:4718122, CE (2) chr2:24642853−24642858, CE (3) chr2:24656711−24656722, CE (4) chr2:24682976−24683038, CACNA1C: AF (1) chr6:119196231−119196093, MX (2) chr6:118637730−118637813, CACNA1D: A3 (1) chr14:30129848, CE (2) chr14:30129789−30129848, CE (3) chr14:30137041−30137124, MX (4) chr14:30089296−30089379, MX (5) chr14:30107653−30107712, MX (6) chr14:30171296−30171399, RI (7) chr14:30128798−30129789, CACNA1E: A5 (1)chr1:154471338, CE (2) chr1:154404885−154405013, MX (3) chr1:154416061−154416157, CACNA1G: CE (1) chr11:94423671−94423724, CE (2) chr11:94439709−94439777,CACNA2D1: CE (1) chr5:16322539−16322595, CE (2) chr5:16341990−16342010, CACNB1:A5 (1) chr11:98010004, AF (2) chr11:98023034−98022887, CE (3) chr11:98010627−98010646, CE (4) chr11:98011343−98011497, MX (5) chr11:98010627−98010646, CACNB2: A5 (1) chr2:4971646, AF (2) chr2:4739216−14739763,AF (3) chr2:4763129−14763992, MX (4) chr2:14967942−14968075, CACNB3: A3 (1)chr15:98640686, AF (2) chr15:98631805−98631931, AF (3) chr15:98632376−98632520, CE (4) chr15:98640959−98640978, MX (5) chr15:98640959−98640978, CACNB4: AF (1)chr2:52676582−52676271, AF (2) chr2:52676831−52676271, CE (3) chr2:52556202−52556361, MX (4) chr2:52465894−52465913, CACNG5: AF (1) chr11:107915055−107914900. For this analysis, the fastq-files were mapped to the referencegenome (mm10) with Salmon[Citation121] and the percentage-spliced in (PSI) values were computedusing SUPPA2[Citation122].