Figures & data
Table 1. Physical units used in the text
Table 2. Conductances of ion channels
Table 3. Membrane current and Ca2+ handling mechanism related parameters for equations above
Table 4. Initial conditions for state variables
Table 5. Extracellular ion concentrations
Figure 1. Simulated AP (dark blue) and simulated Ca2+ activation function,l, (dark green) between 60–120 ms. In 80 mV, time constant of Ca2+ activation is increased by δτ (light green). Slowing down the Ca2+ activation (%60 for this plot) increases AP duration by δAP (light blue)
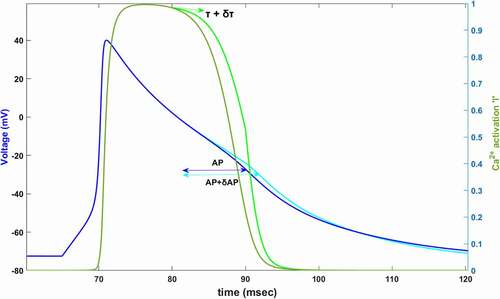
Figure 2. Functions for time-dependent (a) activation of ICaL; (b) activation of INa; (c) fast-inactivation of INa; (d) slow-inactivation of INa; (e) fast-inactivation of ICaL; (f) Ca2+ depedendent-inactivation of ICaL; (g) activation of IKs; (h) activation of Ito; (i) fast-inactivation of Ito; (j) slow-inactivation of Ito. Red marks show epoch points of phase 0, blue marks show epoch points of phase 1, green marks show epoch points of phase 2 and pink marks show epoch points of phase 3. Light blue squares are phase points on each curve
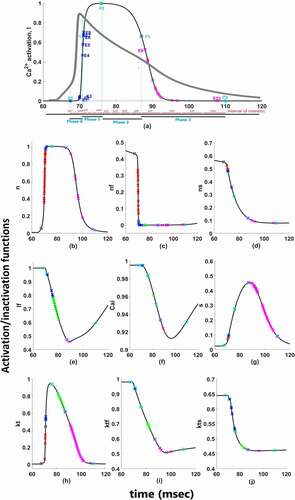
Figure 3. Sign convention of the contribution analysis method. The traces of (a) show sign of contribution value of Na+ gating variables under the effect of Na+ Nernst potential while membrane is in depolarization state. The traces of (b) show sign of contribution value of Ca2+ gating variables under the effect of Ca2+ Nernst potential in repolarization state and the traces of (c) show sign of contribution value of K+ gating variables under the effect of K+ Nernst potential in repolarization state
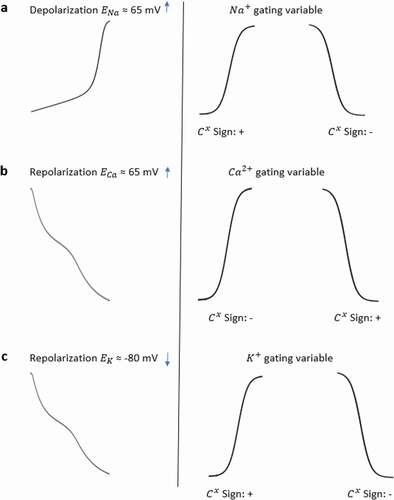
Figure 4. Contribution results after the simulations are defined as a heatmap between −0.01 and 0.01. Each phase (P0,1,2,3) is divided into four equal interval of interests (IoI1,2,3,4) calculated as aggregated epochs. Each time dependent function in the model that has a role to shape cardiac action potential is measured and their roles are quantified in the table
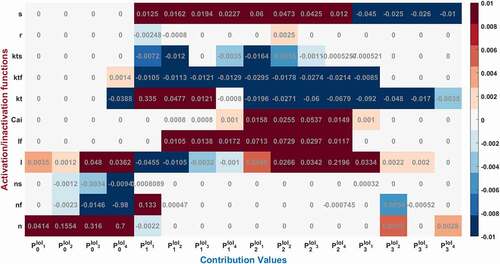
Figure 5. Contribution quantification for Na+ current activation “n”, fast inactivation “nf” and slow inactivation ‘ns’during ventricular AP depolarization (phase 0 is between 67.44 and70.92 ms), early repolarization (phase 1 is between 70.92 and76 ms), plateau (phase 2 is between 76 and 90.76 ms) and late repolarization (phase 3 is between 90.76 and110 ms). Regions for the action potential duration of %20 (AP20), %50 (AP50) and %90 (AP90) are also shown. All phases are divided into four equal IoI regions as color coded
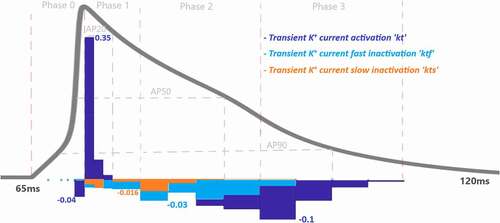
Figure 6. Contribution quantification for Ca2+ current activation “l”, fast inactivation “lf” and Ca2+ dependent inactivation “Cai” during ventricular AP depolarization (phase 0), early repolarization (phase 1), plateau (phase 2) and late repolarization (phase 3). Regions for the action potential duration of %20 (AP20), %50 (AP50) and %90 (AP90) are also shown. All phases are divided into four IoI regions as color coded
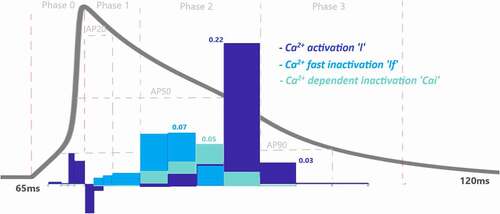
Figure 7. Contribution quantification for K+ current activation “kt”, fast inactivation “ktf” and slow inactivation “kts” during ventricular AP depolarization (phase 0), early repolarization (phase 1), plateau (phase 2) and late repolarization (phase 3). Regions for the action potential duration of %20 (AP20), %50 (AP50) and %90 (AP90) are also shown. All phases are divided into four IoI regions as color coded
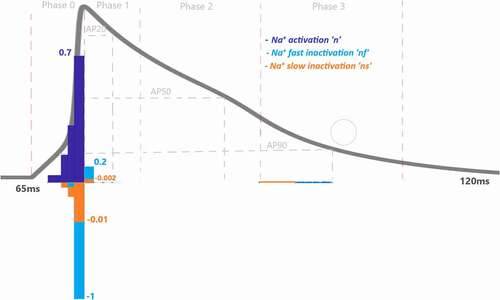
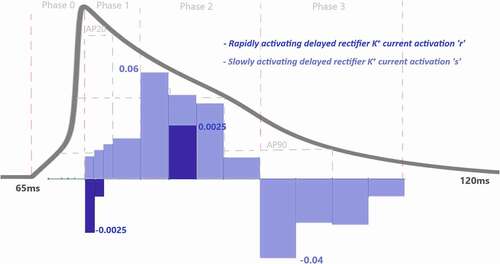
Figure 8. Contribution quantification for rapidly activating delayed rectifier K+ current activation “r” and slowly activating delayed rectifier K+ current activation “s” during ventricular AP depolarization (phase 0), early repolarization (phase 1), plateau (phase 2) and late repolarization (phase 3). Regions for the action potential duration of %20 (AP20), %50 (AP50) and %90 (AP90) are also shown. All phases are divided into four IoI regions as color coded