Figures & data
Figure 1. (a).Alteration frequency of SLC45A1 across cancers. (b).Alteration frequency of SLC45A2 across cancers. (c).Alteration frequency of SLC45A3 across cancers. (d).Alteration frequency of SLC45A4 across cancers
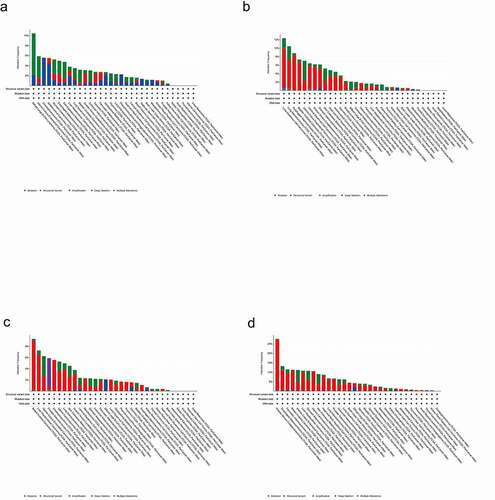
Figure 2. (a-d). The 186 melanomas were divided into 167 G1 (primary) and 19 G2 (metastatic) groups. A total of 1809 normal skin samples were collected. Differential expression analysis was performed between the G1, G2, and normal groups. The results showed that compared with normal tissues, SLC45A1 was down-regulated in G1 and G2 groups, while SLC45A2, SLC45A3 and SLC45A4 were up-regulated in G1 and G2 groups, with statistical significance (P < 0.05). (e-h).Overall survival analysis of SLC45A1-A4 expression in melanoma (GEPIA): The high expression of SLC45A2 and SLC45A3 could significantly reduce the overall survival rate. (i-l).Disease-free survival analysis of SLC45A1-A4 expression in melanoma (GEPIA): The high expression of SLC45A2 and SLC45A3 could significantly reduce the disease-free survival rate
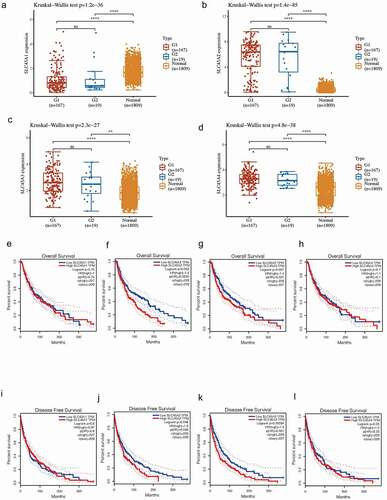
Figure 3. (a-d). Clinical characteristic association of SLC45 family in melanoma:Each column represents a characteristic variable, different colors represent different types or stages, and lines represent the distribution of the same sample in different characteristic variables. (e). The heat map of the top 100 co-expressed genes with SLC45A2. (d). The heat map of the top 100 co-expressed genes with SLC45A3
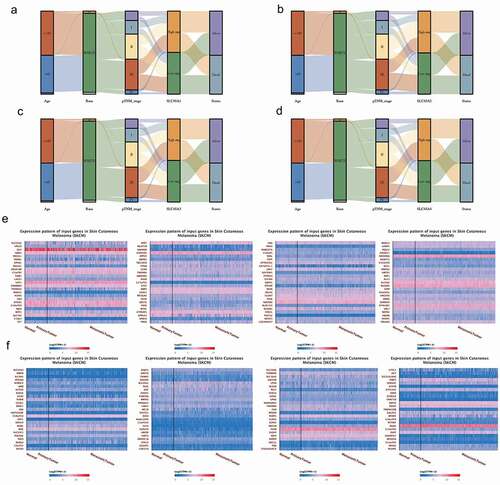
Figure 4. (a).GO enrichment analysis of co-expressed genes of SLC45A2. (b).GO enrichment analysis of co-expressed genes of SLC45A3. (c). KEGG enrichment analysis of co-expressed genes of SLC45A2. (d).KEGG enrichment analysis of co-expressed genes of SLC45A3
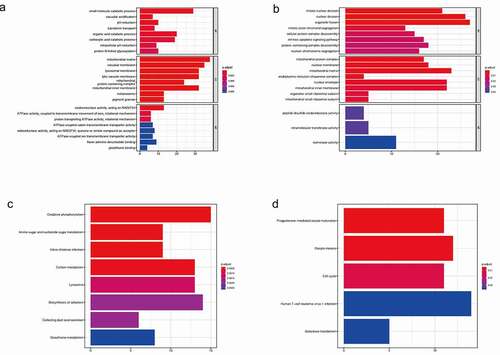
Figure 5. (a).Protein-protein interaction (PPI) network for co-expressing genes of SLC45A2. (b).Protein-protein interaction (PPI) network for co-expressing genes of SLC45A2. (c). The top 10 proteins in the PPI network of SLC45A2 according to the MCC score. (d). The top 10 proteins in the PPI network of SLC45A2 according to the MCC score. (e). The proteins which are most closely associated with SLC45A2
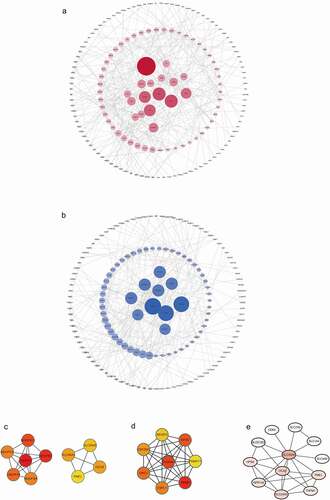
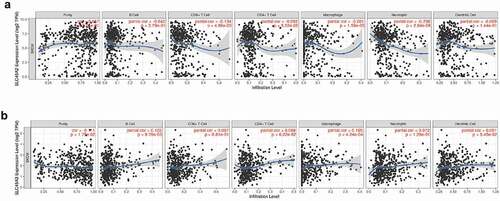
Figure 6. Immue infiltration linked to SLC45A2 and SLC45A3 in melanoma (TIMER): (a). The expression of SLC45A2 was significantly correlated with the infiltration of CD8 + T cells(p = 4.86e-03), macrophages(p = 1.59e-05), and neutrophils(p = 2.64e-08) in melanoma. (b).The expression of SLC45A3 was significantly correlated with the infiltration of B cells(p = 9.79e-03), macrophages(p = 4.24e-04) in melanoma