
Figures & data
Figure 1. Analysis of annual publications. The numbers of annual publications on TRPV1 channel and inflammation.
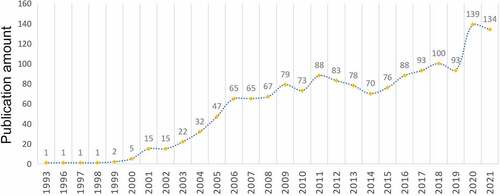
Figure 2. Analysis of country and institution. (a) The publication distribution related to TRPV1 channel and inflammation of top 10 countries; (b) Network map of the main countries of publications by CiteSpace; (c) Network map of institutions in the research about TRPV1 channel and inflammation; (d) The publication distribution related to TRPV1 channel and inflammation of top 11 institutions. The purple round represents centrality. Nodes with high centrality are usually regarded as pivotal points in the field.
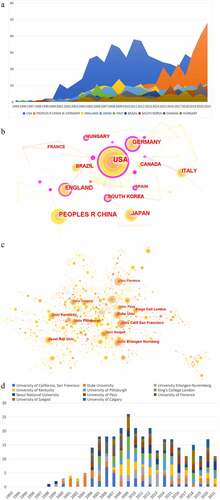
Table 1. Top 10 countries/regions of publications and centrality in TRPV1 channel and inflammation field.
Table 2. Top 10 institutions of publications and centrality in TRPV1 channel and inflammation field.
Figure 3. The dual-map overlay of journals related to TRPV1 channel and inflammation research. Colored curves symbolized paths of references, where each curve originated from a citing journal on the left side of the dual-map and pointed at a cited journal on the right side.
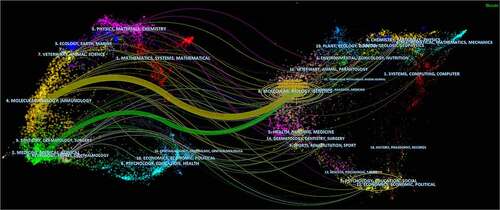
Figure 4. Analysis of journals and co-cited journals in TRPV1 channel and inflammation. (a) the distribution density of journals in the research by VOSviewer; (b) Network map of co-cited journals in the research by CiteSpace; (c) Top 25 cited journals with the strongest citation bursts in the research by CiteSpace.
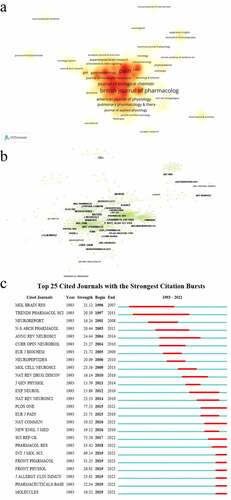
Table 3. Top 10 productive journals in TRPV1 channel and inflammation field.
Table 4. Top 10 productive cited journals in TRPV1 channel and inflammation field.
Figure 5. Analysis of authors and co-cited authors in TRPV1 channel and inflammation. Network map of authors (a) and cited authors (b) by CiteSpace.
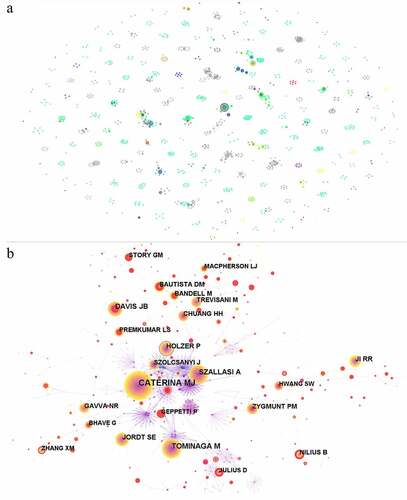
Table 5. Top 10 authors of publications in TRPV1 channel and inflammation field.
Table 6. Top 10 cited authors of publications in TRPV1 channel and inflammation field.
Figure 6. Analysis of co-cited references. (a) the density of co-cited references in TRPV1 channel and inflammation by VOSviewer; (b) the network map of co-cited references in TRPV1 channel and inflammation by CiteSpace; (c) Top 25 references with the strongest citation bursts in this research; (d) the timeline view of the 19 clusters.
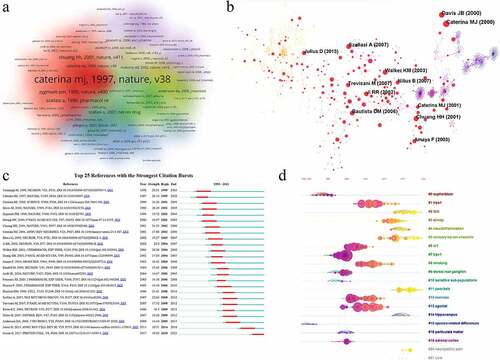
Table 7. Top 10 references with citations in TRPV1 channel and inflammation field.
Figure 7. Analysis of keywords and burst detection. The network map of keywords in TRPV1 channel and inflammation by Citespace (a) and VOSviewer (b); (c) the density of keywords in TRPV1 channel and inflammation by VOSviewer; (d) Cluster visualization of the keyword map; (e) the timeline view of the clusters; (f) Top 25 keywords with the strongest citation bursts.
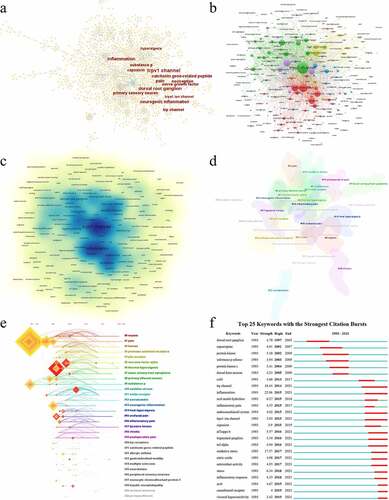
Table 8. Top 20 keywords in terms of frequency in TRPV1 channel and inflammation field.
Supplemental Material
Download MS Word (121.9 KB)Data availability statement
The authors confirm that the data supporting the findings of this study are available within the article and its supplementary materials.