
Figures & data
Figure 1. Comparison of inward rectifier K channel sequences near the TIGYG selectivity filter, indicating the presence of either a Phe or a Tyr aromatic residue just outside the selectivity filter.
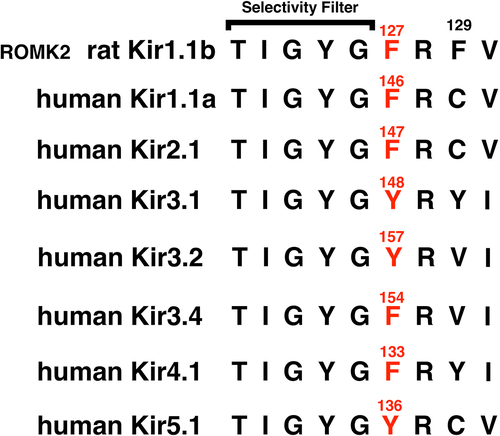
Figure 2a. Representative Kir1.1b single channel inward current record in a cell-attached patch with 10 mM K, zero Ca in the pipette (outside of channel). Oocytes were depolarized by 100 mM K in the bath, which maintained internal oocyte [K] near 100 mM and allowed the patch potential to be calculated as the negative of the pipette command potential. Inward current averaged 2.5 pA at a patch voltage of −100 mV (inside negative). In this and all subsequent figures, permeant acetate buffers at pHo = 8.4 maintained internal oocyte pHi = 7.4, which guarantees that the Kir1.1 bundle crossing gate remains open.
![Figure 2a. Representative Kir1.1b single channel inward current record in a cell-attached patch with 10 mM K, zero Ca in the pipette (outside of channel). Oocytes were depolarized by 100 mM K in the bath, which maintained internal oocyte [K] near 100 mM and allowed the patch potential to be calculated as the negative of the pipette command potential. Inward current averaged 2.5 pA at a patch voltage of −100 mV (inside negative). In this and all subsequent figures, permeant acetate buffers at pHo = 8.4 maintained internal oocyte pHi = 7.4, which guarantees that the Kir1.1 bundle crossing gate remains open.](/cms/asset/004866f3-62ef-445c-acfb-13d0e90aea66/kchl_a_2294661_f0002a_oc.jpg)
Figure 2b. The single channel current voltage relation corresponding to the cell-attached patch of with 10 mM pipette K (outside surface) and a presumed internal [K] of 100 mM in this 100 mM external K depolarized oocyte. Single channel inward conductance was 25 pS (dashed line) and the reversal potential was −59 mV in this recording, indicating a high K selectivity for a 10 fold K ratio across the patch.
![Figure 2b. The single channel current voltage relation corresponding to the cell-attached patch of Figure 2a with 10 mM pipette K (outside surface) and a presumed internal [K] of 100 mM in this 100 mM external K depolarized oocyte. Single channel inward conductance was 25 pS (dashed line) and the reversal potential was −59 mV in this recording, indicating a high K selectivity for a 10 fold K ratio across the patch.](/cms/asset/cb3c3522-b5e6-4813-8ee4-0b3f8036ada8/kchl_a_2294661_f0002b_oc.jpg)
Figure 3. F127V single channel current-voltage curve for cell-attached patch recordings similar to fig 4A. The pipette contained 10 mM K, 0 Ca. Oocytes with a nominal internal [K] of 100 mM were depolarized to near zero potential by 100 mM K in the bath. Average single channel conductance (gK) = 14 ± 2pS (n = 5 oocytes) for inward currents (dashed line), and Erev = −60 mV for a 10 fold inside/outside K gradient.
![Figure 3. F127V single channel current-voltage curve for cell-attached patch recordings similar to fig 4A. The pipette contained 10 mM K, 0 Ca. Oocytes with a nominal internal [K] of 100 mM were depolarized to near zero potential by 100 mM K in the bath. Average single channel conductance (gK) = 14 ± 2pS (n = 5 oocytes) for inward currents (dashed line), and Erev = −60 mV for a 10 fold inside/outside K gradient.](/cms/asset/c6ce6422-9605-483b-b12d-04e04b088a08/kchl_a_2294661_f0003_oc.jpg)
Figure 4a. Representative F127V single-channel currents for a cell-attached patch with 10 mM K and zero Ca in the pipette, similar to those used to construct the current voltage relation of Figure 3. Oocytes with a nominal internal [K] of 100 mM were depolarized to near zero potential by 100 mM K in the bath. Patch potential is indicated at the right of each tracing and the closed state is denoted by c.
![Figure 4a. Representative F127V single-channel currents for a cell-attached patch with 10 mM K and zero Ca in the pipette, similar to those used to construct the current voltage relation of Figure 3. Oocytes with a nominal internal [K] of 100 mM were depolarized to near zero potential by 100 mM K in the bath. Patch potential is indicated at the right of each tracing and the closed state is denoted by c.](/cms/asset/2fe4f7bf-a567-4b22-9e4f-9d0985d41dba/kchl_a_2294661_f0004a_b.gif)
Figure 4b. Kinetics for the single-channel F127V currents of Figure 4a at a patch potential of –100 mV (inside negative). In the absence of pipette Ca, F127V is characterized by a single open time of 19.4 ms and a single closed time of 3.3 ms.
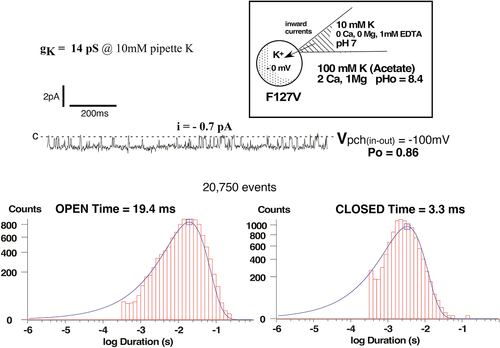
Figure 5. F127V has a lower single channel inward conductance than wild-type Kir1.1b at all external K concentrations. Data were obtained under steady state conditions in cell-attached patches at different pipette K concentrations without Ca or Mg. Oocytes were K-depolarized by 100 mM bath [K], and inward conductances were computed from linear fits of the i-v data acquired between −20 mV and −200 mV.
![Figure 5. F127V has a lower single channel inward conductance than wild-type Kir1.1b at all external K concentrations. Data were obtained under steady state conditions in cell-attached patches at different pipette K concentrations without Ca or Mg. Oocytes were K-depolarized by 100 mM bath [K], and inward conductances were computed from linear fits of the i-v data acquired between −20 mV and −200 mV.](/cms/asset/815103f1-a907-41e5-9b91-082bf43bc10b/kchl_a_2294661_f0005_oc.jpg)
Figure 6. Positive membrane voltage suppresses whole-cell F127V outward currents (red) relative to wt-Kir1.1b (black) in a typical current-voltage relation. Data were normalized to maximum inward current to compensate for different expression levels of F127V and wt-Kir1.1b in oocytes. External bath: 10 mM K, zero Ca at pHo = 8.4 with acetate buffer. Internal oocyte [K] was not directly measured but was presumed close to its average nominal value of 100 mM. Other paired oocyte experiments yielded F127V and wt-Kir1.1b currents similar to .
![Figure 6. Positive membrane voltage suppresses whole-cell F127V outward currents (red) relative to wt-Kir1.1b (black) in a typical current-voltage relation. Data were normalized to maximum inward current to compensate for different expression levels of F127V and wt-Kir1.1b in oocytes. External bath: 10 mM K, zero Ca at pHo = 8.4 with acetate buffer. Internal oocyte [K] was not directly measured but was presumed close to its average nominal value of 100 mM. Other paired oocyte experiments yielded F127V and wt-Kir1.1b currents similar to Figure 6.](/cms/asset/495bed81-3c0c-4ae8-86e9-74f95ea1202d/kchl_a_2294661_f0006_oc.jpg)
Figure 7. Relief of rectification in wt-Kir1.1b by external K elevation. Representative whole-cell current-voltage curves were obtained from an individual oocyte bathed in zero Ca, zero Mg and successive external K concentrations of 1 mM, 5 mM and 10 mM. Other oocytes (n = 4, obtained on different days) showed similar K dependence of their I-V curves, but with different absolute current levels. Abscissa is oocyte membrane potential relative to bath (ground). Internal oocyte [K] was not directly measured but was presumed close to it’s average nominal value of 100 mM. Shifts in reversal potentials at different external K are consistent with wt-Kir1.1b having a high K selectivity.
![Figure 7. Relief of rectification in wt-Kir1.1b by external K elevation. Representative whole-cell current-voltage curves were obtained from an individual oocyte bathed in zero Ca, zero Mg and successive external K concentrations of 1 mM, 5 mM and 10 mM. Other oocytes (n = 4, obtained on different days) showed similar K dependence of their I-V curves, but with different absolute current levels. Abscissa is oocyte membrane potential relative to bath (ground). Internal oocyte [K] was not directly measured but was presumed close to it’s average nominal value of 100 mM. Shifts in reversal potentials at different external K are consistent with wt-Kir1.1b having a high K selectivity.](/cms/asset/92a179e9-ec3a-4af5-91a8-8cdcd7f3b090/kchl_a_2294661_f0007_oc.jpg)
Figure 8. Effect of external K on the whole cell F127V-Kir1.1b current-voltage relation. Representative whole-cell current-voltage curves were obtained from an individual oocyte bathed in zero Ca, zero Mg and successive external K concentrations between 1 mM and 10 mM. Other oocytes (n = 6, obtained on different days) showed similar K dependence of their I-V curves, but with different absolute current levels. Abscissa is oocyte membrane potential relative to bath (ground). Shifts in reversal potentials at different external K are consistent with F127V-Kir1.1b having a high K selectivity.
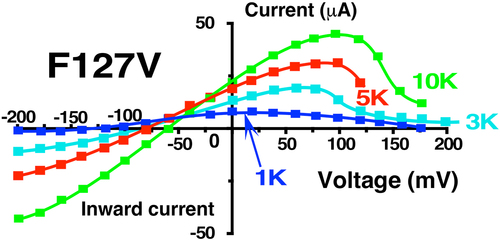
Figure 9. Representative example of a rapid decrease in F127V whole-cell outward conductance following replacement of 10 mM bath K with a zero K solution plus 15 mM 18-Crown ether (a K chelator) in Ca free conditions. Note the shift in reversal potential upon switching the bath from 10 mM K (−60 mV) to nominally zero K (−125 mV), assuming an oocyte internal [K] = 100 mM, as in previous protocols.
![Figure 9. Representative example of a rapid decrease in F127V whole-cell outward conductance following replacement of 10 mM bath K with a zero K solution plus 15 mM 18-Crown ether (a K chelator) in Ca free conditions. Note the shift in reversal potential upon switching the bath from 10 mM K (−60 mV) to nominally zero K (−125 mV), assuming an oocyte internal [K] = 100 mM, as in previous protocols.](/cms/asset/85e573ab-215b-42ab-8c37-7f3a46c0640a/kchl_a_2294661_f0009_oc.jpg)
Figure 10. Decrease in whole-cell outward conductance (GK) following transitions from 10 mM K to zero K plus 15 mM of the K chelator: 18-Crown-6 (catalog no. 274984, Sigma-Aldrich), in zero Ca solutions. Outward conductances were normalized to the initial conductance in 10 mM K. Data from F127V oocytes (n = 5) and wt-Kir1.1b oocytes (n = 6) were fitted to a first order exponential decay yielding half-times of 0.1 min for F127V and 2 min for Kir1.1b. Outward macroscopic conductances were calculated as the slope of the I-V relation near the reversal potential which varied between −60 mV at 10 mM K to −110 mV at zero bath K.
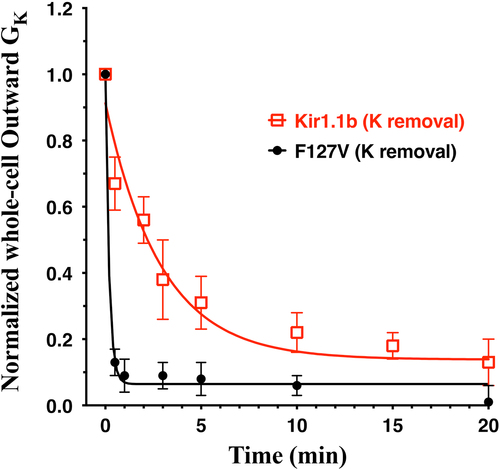
Figure 11a. Addition of 2 mM Ca decreased F127V inward single channel conductance from 27 ± 1pS (zero Ca, red line, n = 5 patches) to 19 ± 2pS (2 mM Ca, blue line) in 4 cell-attached F127V patches with 100 mM K in the pipette. Oocytes, with presumed 100 mM internal K, were depolarized to zero potential by 100 mM K in the bath. Hence the membrane patch potential, Vpch (in-out), equals the negative of the pipette command potential. Outward currents with Ca in the pipette were too small to be reliably resolved at positive potentials and were excluded from the linear fit.
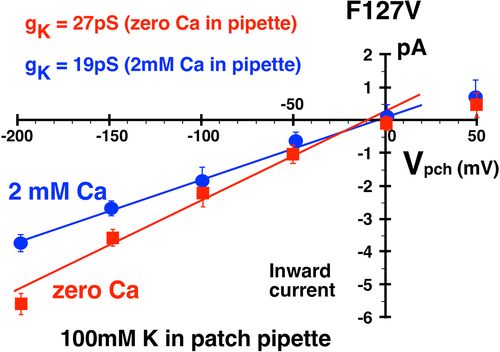
Figure 11b. Addition of 2 mM Ca decreased F127V inward single channel conductance from 13pS (zero Ca, red line) to 10pS (blue line) in cell-attached F127V patches with 10 mM K in the pipette. Oocytes, with presumed 100 mM internal K, were depolarized to zero potential by 100 mM K in the bath. Hence the membrane patch potential, Vpch (in-out), equals the negative of the pipette command potential. Outward currents with Ca in the pipette were too small to be reliably resolved at positive potentials and were excluded from the figure.
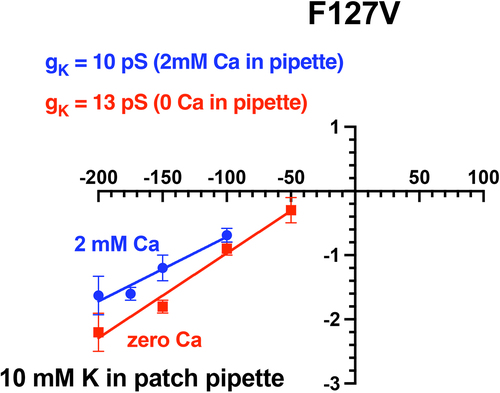
Figure 12a. Representative inward single-channel F127V currents from a cell-attached recording with 100mM K and 2 mM Ca in the pipette. Oocyte membrane potential was depolarized to near 0 mV by 100 mM K in the bath, causing Vpch(in-out) to equal the negative of the pipette command potential. Acetate buffer in bath solution set outside pH at 8.4 which stabilizes pHi at 7.4, causing a fully open bundle crossing gate. Downward deflections from the dashed closed line (c) denote inward K currents. At a patch potential (Vpch) of –100mV, open probability (Po) = 0.76.
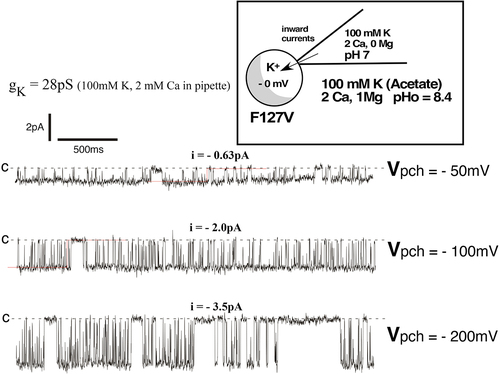
Figure 12b. Inward single-channel F127V currents in a cell-attached recording with 100mM K and 2 mM Ca in the pipette. Single channel inward conductance was 28pS. At Vpch = –100mV there was a single open time of 17.9ms and 2 closed times of 2.6ms and 154ms, resulting in a Po of 0.76.
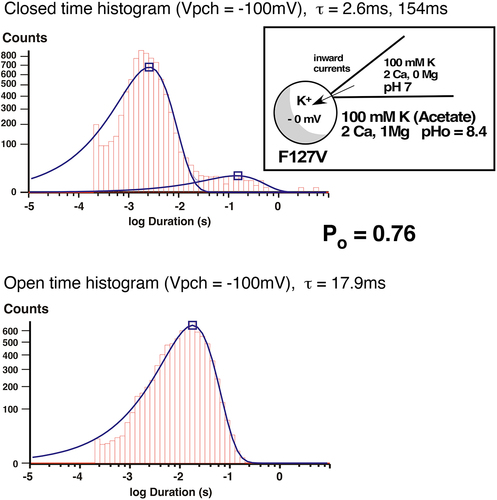
Figure 13. External Ca (5 mM) decreased F127V whole cell current and conductance to near zero in two-electrode voltage clamp experiments. Representative whole-cell current-voltage curves were obtained from an individual oocyte bathed in 10 mM K, zero Ca bath (green circles) followed by 10 mM external K and 5 mM Ca (red squares). Other oocytes (n = 4, obtained on different days) showed similar Ca dependence, but at different absolute current levels. Abscissa is oocyte membrane potential relative to bath (ground).
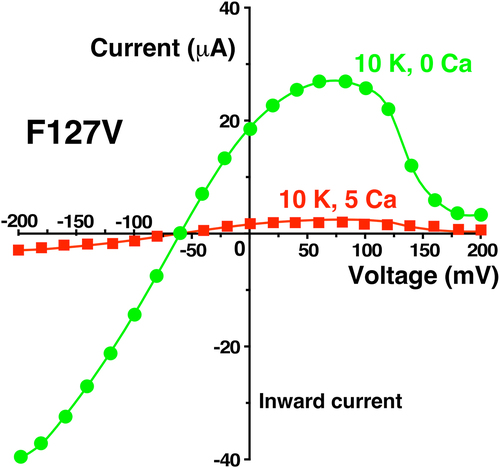
Figure 14. External Ca (5 mM) produced only a small decrease in wt-Kir1.1b whole cell current and conductance in two-electrode voltage clamp experiments. Representative whole-cell current-voltage curves were obtained from an individual oocyte bathed in 10 mM K, zero Ca bath (green circles) followed by 10 mM external K and 5 mM Ca (red squares). Other oocytes (n = 5, obtained on different days) showed similar Ca dependence, but at different absolute current levels.
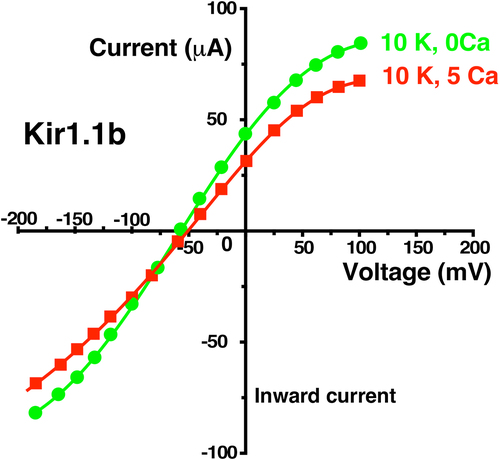
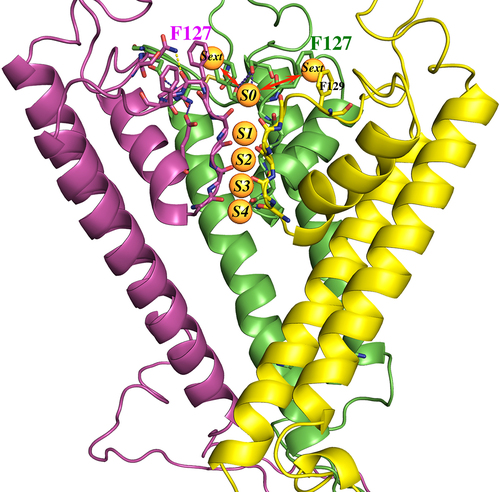
Figure 15. Homology model of Kir1.1b in the closed state, showing 3(of 4) identical subunits (each in a different color). Aromatic residues F127 and F129 from each subunit are at the extracellular end of the permeation path. Five specific K binding sites (S0 to S4) are located along the Kir1.1b permeation path. The K ions at S0 and S4 are presumably half hydrated, and the K ions at Sext are probably fully hydrated. Model generated using MOE (Molecular operating environment, Montreal, Canada) with the closed-state 3.1 angstrom crystal structure of the chicken inward rectifier Kir2.2 (3JYC) as template.
Data availability statement
The data that support the findings of this study are available from the corresponding author, [HS], upon reasonable request.