
Figures & data
Figure 1. Timeline of the study phases, the intervention activities, and the data collection. The control workplaces participated only in the data collection (dark grey), while the intervention workplaces participated in all the intervention activities and the data collection.
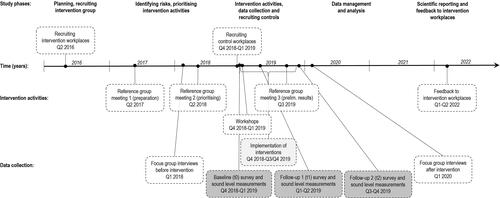
Table 1. The selected and prioritized context-specific intervention contents implemented in the obstetrics care and the preschool setting.
Table 2. Baseline values for the outcome variables with categories or scale as analyzed, shown as valid column percentages (%*), or mean and standard deviation (SD), within the obstetrics setting and the preschool setting, separating the intervention workplace from the controls.
Figure 2. Participant flow diagram detailing number of personnel enrolled, lost to follow-up, responding at each timepoint, and the final study sample included in the analysis.
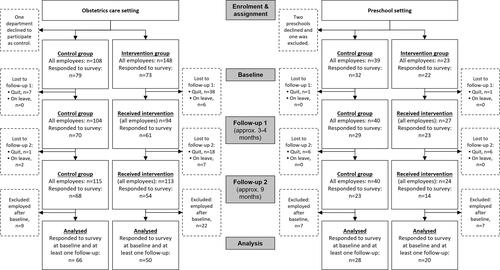
Figure 3. Descriptive data of the individual change in the outcomes as valid percentages reporting improvement (green), worsening (orange) or remaining unchanged (grey) from baseline to follow up (merging results from t1 and t2) within the intervention group (I) and control group (C) respectively, in the obstetrics care setting (left) and in the preschool setting (right).
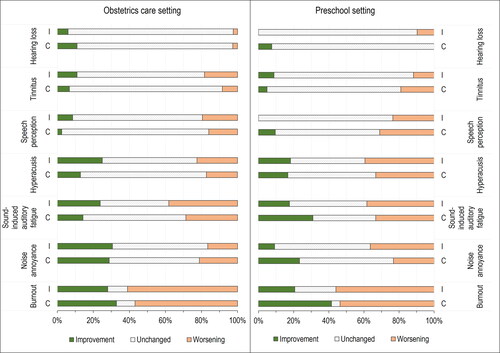
Table 3. Generalized estimating equation (GEE) analyzing the effect of intervention by comparing outcomes at follow-up in the intervention versus the control group in the obstetrics and the preschool setting respectively (control group as reference).
Figure 4. Boxplots of daily A-weighted equivalent sound levels (dB LAeq) from dosimeter measurements in the obstetrics care (left) and in the preschools (right).
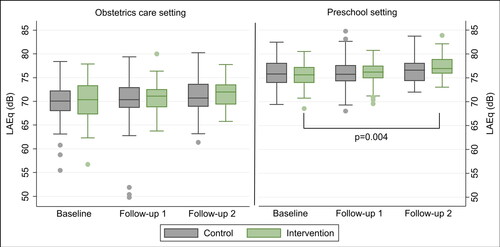
Table 4. Descriptive data and analysis of average sound levels within each group over timepoints and between control and intervention group at each timepoint.
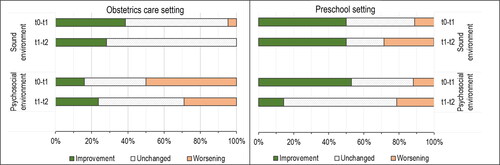
Figure 5. Descriptive responses of perceived changes in the work environment within the intervention groups, showing improvement (green), worsening (orange) or remaining unchanged (grey) from baseline (t0) to the first follow-up (t1), and between the two follow-ups (t1 and t2) in the obstetrics care setting (left) and in the preschool setting (right).
Supplemental Material
Download MS Word (44.5 KB)Data availability statement
The participants of this study did not give consent for data to be shared. However, anonymised data is available upon reasonable request and providing approval from an ethical review board.