


Acknowledgment
We appreciate the lesson development and suggestions provided by Jill Stauffer and Yvonne Strange at Lake Murray Elementary, and Larianne Collins and Monti Caughman at the South Carolina Geographic Alliance.
Notes
Lesson Overview
This lesson introduces students to a real-life event—the loss of ocean cargo that included rubber ducks—through a children's book, 10 Little Rubber Ducks. Using latitude and longitude coordinates, the students plot the journey of the ducks as they ride ocean currents in the north Pacific. Students are further challenged to consider the environmental implications of the lost cargo and refine mathematic skills by determining their journey's rate. This lesson has been successfully taught for grade 5 and is adaptable for other grades.
Time Required
Two class periods (assumes one period for latitude/longitude practice, one period to complete this activity).
Preparation
Materials/Resources
CitationCarle, E. 2005. 10 Little Rubber Ducks. New York: Harper Collins.
Table 1. Coordinate Pairs for Lost Ducks.
North Pacific Map with latitude and longitude grid. Available for download at: http://artsandsciences.sc.edu/cege/rubberduckmap.pdf
Map of ocean gyres/currents
Google Earth or a globe
Pens or pencils
Standards
National Geography Standards
1. How to use maps and other geographic representations, geospatial technologies, and spatial thinking to understand and communicate information.
7. The physical processes that shape the patterns of Earth's surface.
14. How human actions modify the physical environment.
South Carolina Science Academic Standards
5-3.5 Compare the movement of water by waves, currents, and tides.
5-3.6 Explain how human activity (including conservation efforts and pollution) has affected the land and the oceans of Earth).
Common Core Mathematics Standards
CCSS.MATH.CONTENT.5.G.A.1
Use a pair of perpendicular number lines, called axes, to define a coordinate system, with the intersection of the lines (the origin) arranged to coincide with the 0 on each line and a given point in the plane located by using an ordered pair of numbers, called its coordinates. Understand that the first number indicates how far to travel from the origin in the direction of one axis, and the second number indicates how far to travel in the direction of the second axis, with the convention that the names of the two axes and the coordinates correspond (e.g., x-axis and x-coordinate, y-axis and y-coordinate).
CCSS.MATH.CONTENT.5.G.A.2
Represent real world and mathematical problems by graphing points in the first quadrant of the coordinate plane, and interpret coordinate values of points in the context of the situation.
Objectives
The student will reconstruct the ducks' journey by using latitude/longitude coordinate plots.
The student will identify ocean currents contributing to the ducks' movement.
The student will use a globe or similar to identify other possible destinations for the ducks.
The student will use the ducks' travel data to estimate their rate of speed.
Instruction
Opening Instruction
1. The teacher begins by referencing previous work with latitude and longitude. It may be appropriate for a review activity before beginning the reading activity.
Developing Instruction
2. The teacher reads aloud the picture book 10 Little Rubber Ducks. Once the story is read, students are asked their thoughts about whether the story is actually true. The teacher then explains the real event and informs the students that they will use a map and data coordinates to chart the ducks' journey in the north Pacific Ocean.
3. The teacher provides each student with the north Pacific map and , the coordinate pairs for the ducks. Each point should be plotted and a line drawn connecting each to create a path. The teacher will need to monitor progress as completion rates will vary.
4. Once the map is completed, the teacher shares a map of ocean gyres and currents. This may be done with a handout or via a Smart Board/projection system. The students then identify the currents responsible for the ducks' movement. Answers will include the North Pacific, Alaska, Kamchatka, and Oyashio currents.
5. Students are then asked if the ducks could make their way to Europe. After entertaining responses from the students, a globe or Google Earth can be used to show a possible route across the North Pole.
6. Using the travel data provided in , the students then calculate the ducks' rate of speed. For example, Points 3 and 4 are approximately 900 miles apart. With a travel time from July to October, the time expended is 123 days. In this calculation, the ducks moved about .3 miles per hour ((900 miles/123 days)/24 hours). Students may be asked to calculate the rate of speed between other points as well.
Concluding Instruction
7. The lesson is concluded by asking the students why this particular event is important to their environment. After fielding responses, the teacher discusses marine pollution (e.g.: the “Great Pacific Garbage Patch”). The teacher should make sure that the students realize how an event such as the cargo loss of rubber ducks can highlight the interconnected nature of Earth.
Assessment
Students will have a completed “duck journey” map. This map may be used to assess their ability to plot latitude/longitude coordinate pairs.
Since this is an introductory lesson the map is not graded, but students can be provided with an overlay (the teacher can print multiple copies of the map on clear overheads) to check their work. Students will then work in pairs to rework any missed coordinates.
The teacher may ask the students to present their ideas about other potential travel routes or the impact of the ducks on the environment in writing.
Students can write a reflection based on critical questions like: Why does what happens on one side of the world matter to the other side? How can we use geography to solve problems? What did you learn about ocean currents and how they impact us?
The mathematic calculations for the ducks' rate of speed may be assessed for accuracy.
Extending the Lesson
Use this lesson as a “jumping off” point for a study on the human impact on the environment. Students may work in pairs or individually to study one way humans have negatively impacted the environment. They can present their research along with what students can do to help.
Provide students with another set of coordinates to plot and grade for accuracy.
Use GPS units with the class. Have students create waypoints and plot their own coordinate data.
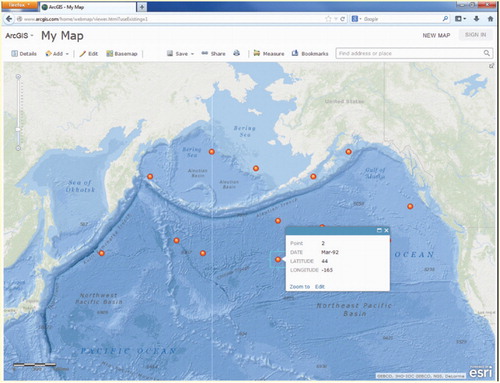
Utilize Google Earth or a website like ArcGIS.com to extend their new appreciation of geography and mapping ().
A lab on currents can better help students understand the movement of warm and cold water: 1. Place one large rock in ice and one in boiling water. 2. Fill a clear tub with water. 3. Carefully place the rocks in opposite corners. 4. Drop a few drops of blue food dye on top of the cold rock and red on top of the hot rock. 5. Allow the students to watch the motion of the colored water and where purple water forms.
Other published lessons on the “lost ducks” may be of interest. See ideas by a variety of authors in “Ducks Ahoy! Plastic Debris and Ocean Currents”, Middle Level Learning, Number 46, January/February 2013 and CitationNagel, P. and D. Beauboeuf (2012).
Notes
1 For an overview, see CitationNational Public Radio (2011).
2 While we stopped reading Carle's book at the point of the accident, some teachers may want to continue with the story. The ducks soon encounter a seal, a dolphin, and other friendly animals that share the sea.
3 These coordinate pairs are modified from work by CitationHarris, Archer, and Lundell (2006), from the original source material in CitationIngraham (1997). Harris et al originally modified the coordinate pairs “to reduce confusion over east and west longitude” as the study area crosses the International Date Line. We maintain that the proper coordinates should be used rather than having students “unlearn” an incorrect location system.
4 Maps of ocean currents may be found in any number of atlases or online. One digital image is available at the SEOS (Science Education Through Earth Observation for High Schools) website: http://www.seos-project.eu/modules/oceancurrents/oceancurrents-c02-p04.html
5 For additional content information, see CitationNational Geographic Education (2013).
Additional information
Notes on contributors
Jerry T. Mitchell
Jerry T. Mitchell is the director of the Center of Excellence for Geographic Education in the Department of Geography at the University of South Carolina and Coordinator of the South Carolina Geographic Alliance. His research interests are in environmental hazards and geography education. He has been editor of the Journal of Geography since 2010.
Danielle Hance
Danielle Hance teaches 5th-grade math, science, social studies, and language arts at Lake Murray Elementary in Chapin, South Carolina. She is Nationally Board Certified in Early and Middle Childhood Literacy and holds two Master's Degrees in Education. She has taught for twelve years and is passionate about project-based learning.