
Figures & data
Figure 1. Results from previous research on multilevel design parameters for student achievement in elementary and secondary school in the United States: (a) Between-classroom () and between-school differences (
), and explained variances by (b) pretest scores, (c) sociodemographic characteristics, and (d) pretest scores and sociodemographic characteristics at the student (
), classroom (
), and school level (
). Note. Boxplots show distributions across all domains. The distributions in mathematics/science/reading are based on 341/12/370 values for elementary school (grades 1–6) and 266/93/223 values for secondary school (grades 7–12). The underlying data table can be obtained from the Open Science Framework (https://osf.io/2w8nt). In the upper panels of , design parameters obtained from two-level models (students at L1 within schools at L3) are shown as reported in the following studies: Bloom et al. (Citation1999) reported
for elementary schools in 1 city. Bloom et al. (Citation2007) reported
and
for pretests and sociodemographics for elementary and secondary schools in 5 districts. Brandon et al. (Citation2013) reported upper bounds of the means of
across several years for elementary and secondary schools in 1 state. Hedberg et al. (Citation2004) reported
and
for sociodemographics for elementary schools in 120 districts and for secondary schools on a nationwide basis (values are retrieved from Schochet, Citation2008). Hedges and Hedberg (Citation2007a) reported
and
for pretests, sociodemographics, and their combination for elementary and secondary schools on a nationwide basis (across districts and states). Hedges and Hedberg (Citation2013) reported
and
for pretests and sociodemographics for elementary and secondary schools in 11 states (with between-district variance pooled into between-school variance within states). Schochet (Citation2008) reported
for elementary schools based on 3 studies conducted in 6 cities, 12 districts, and 7 states, respectively. Spybrook, Westine, et al. (Citation2016) reported means of
and
across several years for pretests and sociodemographics for elementary and secondary schools in 3 states. Westine et al. (Citation2013) reported means of
and
across 5 years for pretests, sociodemographics, and their combination for elementary and secondary schools in 1 state. In the lower panels of , design parameters obtained from three-level models (students at L1 within classrooms at L2 within schools at L3) are shown as reported in the following studies: Jacob et al. (Citation2010) reported
and
for pretests, sociodemographics and their combination for elementary schools in 6 districts. Xu and Nichols (Citation2010) reported
and
for pretests, sociodemographics, and their combination for elementary and secondary schools in 2 states. Zhu et al. (Citation2012) reported
and
for pretests for elementary and secondary schools on a nationwide basis.
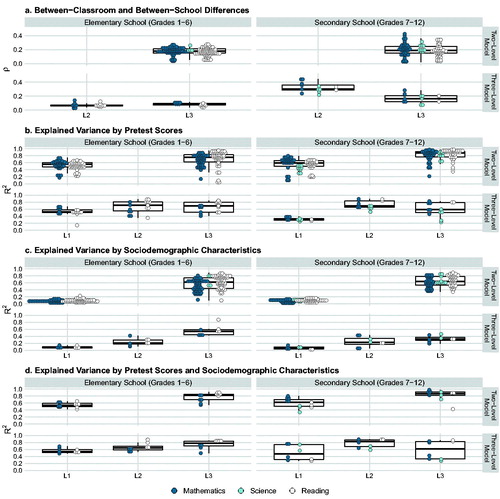
Table 1. Results from previous large-scale studies on student achievement in Germany: Between-classroom () and between-school differences (
) by grade and domain.
Table 2. Number of students (L1), classrooms (L2), and schools (L3), and median cluster sizes by grade, large-scale study, and school track.
Figure 2. Multilevel design parameters for student achievement for the general student population without and with adjustment for mean-level differences between school types: (a) Between-classroom () and between-school differences (
), and explained variances by (b) pretest scores, (c) sociodemographic characteristics, and (d) pretest scores and sociodemographic characteristics at the student (
), classroom (
), and school level (
). Note. Boxplots show distributions across all achievement domains. For grades 1–10, design parameters are based on three-level models (students at L1 within classrooms at L2 within schools at L3). For grades 11–12, design parameters are based on two-level models (students at L1 within schools at L3) as 11th and 12th grade students did not attend intact classrooms, but rather the grouping of students varied depending on the subject taught. This means that design parameters at L2 (i.e.,
and
) were estimated for grades 1–10 only. In , intraclass correlations
were estimated in intercept-only models (model set 1). In , explained variances
by pretests were estimated in pretest covariate(s) models (model set 2). In , explained variances
by sociodemographics were estimated in sociodemographic covariates models (model set 3). In , explained variances
by pretests and sociodemographics were estimated in pretest and sociodemographic covariates models (model set 4). To estimate design parameters that were adjusted for mean-level achievement differences between school types offered in German secondary education (L3 adjusted), dummy-coded indicator variables representing the various school types were added as additional covariates at L3. The complete collection of design parameters is available in Tables B1, B3, B5, B7, B9, B11, B13, and B15 in the Supplemental Online Material B on the Open Science Framework (https://osf.io/2w8nt).
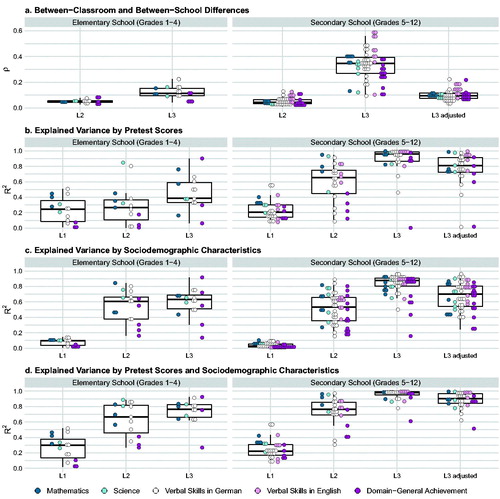
Table 3. Normative distributions of multilevel design parameters for student achievement: (a) Between-classroom () and between-school differences (
), and explained variances by (b) pretest scores, (c) sociodemographic characteristics, and (d) pretest scores and sociodemographic characteristics at the student (
), classroom (
), and school level (
).
Figure 3. How much bias may result in design parameters for student achievement for the general student population at the student (L1) and school level (L3) when the classroom level (L2) is ignored? Comparison of corresponding design parameters obtained from three-level models versus two-level models: (a) Between-school differences (), and variances explained by (b) pretest scores, (c) sociodemographic characteristics, and (d) pretest scores and sociodemographic characteristics at the student (
) and school level (
). Note. The graph juxtaposes corresponding design parameters estimated by three-level models (x-coordinate; students at L1 within classrooms at L2 within schools at L3) with design parameters estimated by two-level models (y-coordinate; students at L1 within schools at L3). The black line marks congruence of three- and two-level design parameters. Larger labeled dots exceed a deviation of ± 0.20 between three- and two-level design parameters. For example, in , left grid (“Student Level (L1)”), the dot labeled with “a” (representing German vocabulary in grade 1) shows that
was 0.24 when specifying a three-level pretest covariate model, whereas
was 0.47 when specifying a two-level pretest covariate model. aVocabulary (NEPS-SC2, grade 1). bDeclarative metacognition (NEPS-SC2, grade 3). cBasic cognitive functions: Reasoning (NEPS-SC2, grade 2). dReading speed (DESI, grade 9, wave 2). eDeclarative metacognition (NEPS-SC2, grade 1). fDeclarative metacognition (NEPS-SC2, grade 3). gBasic cognitive functions: Perception speed (NEPS-SC3, grade 9). hReading speed (NEPS-SC2, grade 2). iBasic cognitive functions: Perception speed (NEPS-SC3, grade 5). jDeclarative metacognition (NEPS-SC2, grade 3). kBasic cognitive functions: Reasoning (NEPS-SC2, grade 2). lBasic cognitive functions: Perception speed (NEPS-SC3, grade 9). mReading speed (NEPS-SC2, grade 2). nBasic cognitive functions: Perception speed (NEPS-SC2, grade 2).
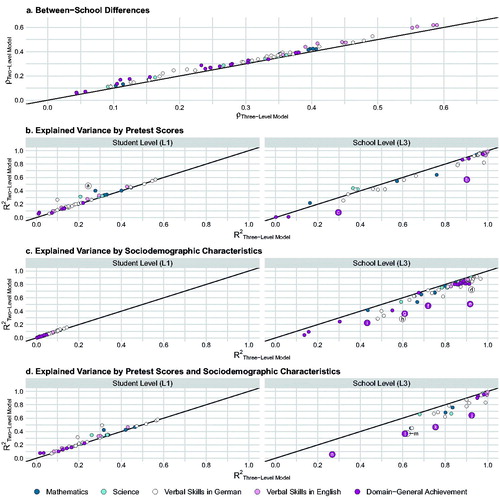
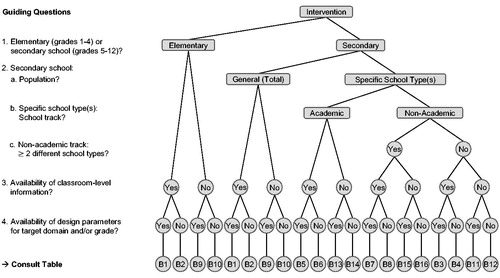
Figure 4. Flow chart to guide the choice of design parameters as a function of key characteristics of the target intervention. Note. Tables B1–B16 can be retrieved from Supplemental Online Material B. A comprehensive overview of the achievement measures analyzed in the present study is given in Table A5 in the Supplemental Online Material A. The Supplemental Online Materials are available on the Open Science Framework (https://osf.io/2w8nt).
Supplemental Material B
Download MS Excel (3.5 MB)Supplemental Material A
Download PDF (524.4 KB)Data Availability Statement
A more detailed description of methods and results (Supplemental Online Material A), a comprehensive compilation of design parameters (Supplemental Online Material B), the R and Mplus scripts that underlie the statistical analyses of this article, and brief descriptions of where and how to access the data and material are available on the Open Science Framework at https://osf.io/2w8nt.
This article uses data from the National Educational Panel Study (NEPS): Starting Cohort 2–Kindergarten, https://doi.org/10.5157/NEPS:SC2:6.0.1, Starting Cohort 3–5th Grade, https://doi.org/10.5157/NEPS:SC3:7.0.1, and Starting Cohort 4–9th Grade, https://doi.org/10.5157/NEPS:SC4:9.1.1. NEPS is carried out by the Leibniz Institute for Educational Trajectories (LIfBi) in cooperation with a nationwide German network. Moreover, this article uses data from the Assessment of Student Achievements in German and English as a Foreign Language (DESI), https://doi.org/10.5159/IQB_DESI_v1, and from the Programme for International Student Assessment – International Plus 2003, 2004 (PISA-I-Plus 2003, 2004), https://doi.org/10.5159/IQB_PISA_I_Plus_v1.