


Figures & data
Table 1. Normative expectations of students’ annual academic growth: total student population.
Table 2. Elementary education (grade 4): normative expectations for performance gaps between student demographic groups.
Table 3. Lower secondary education (grade 8, 9 and 10): normative expectations for performance gaps between student demographic groups.
Table 4. Upper secondary education (grade 11 and 12): normative expectations for performance gaps between student demographic groups.
Figure 1. Performance Gap Between Weak and Average Schools (adapted from Bloom et al., Citation2008, p. 314). Note. To estimate performance gaps between schools, we adapted the approach by Bloom et al. (Citation2008). Specifically, we drew on the standard assumption of multilevel models that the random-coefficients (u0j) that depict regression-adjusted mean-level differences between schools (i.e., the regression-adjusted school-average achievement levels) are normally distributed with mean zero and standard deviation τ. To obtain an estimate of τ we used a two-level random-intercept model (Level 1: students, Level 2: schools) in which students’ (grand-mean centered) prior achievement, their (grand-mean centered) SES, and information on students’ gender and migration background were entered as predictors at Level 1 for each achievement outcome. Schools with a regression-adjusted school-average achievement level below/at/above zero score worse/same/better than other schools with students of the same prior achievement level and socio-demographic background characteristics. The figure shows the distribution for τ = 1.
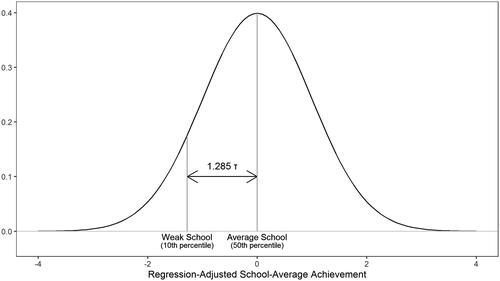
Table 5. Performance gaps between weak and average schools: total student population.