
Figures & data
Table 1. Number of terrorist attacks by month in India 1998–2017.
Table 2. Monthly data points, stations, & kriging results.
Figure 1. Average temperatures in India comparing 1968–1997 to 1998–2017.
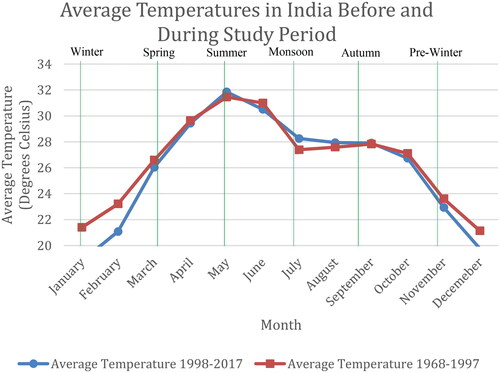
Table 3. One-sample T-test comparing average temperatures from 1968–1997 to 1998–2017.
Figure 2. Kernel density of all terrorist incidents 1998–2017.
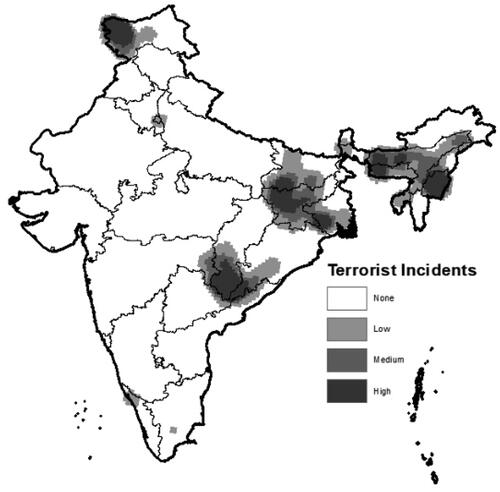
Figure 3. India’s distance to the equator.
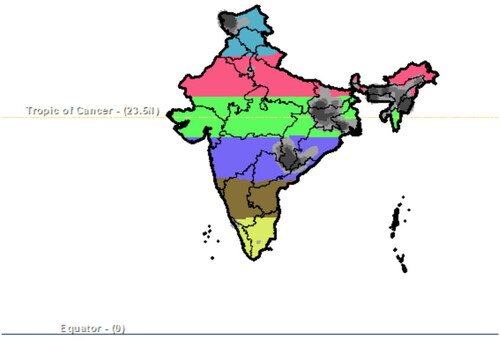
Figure 4. Comparison of May and July climate variables.
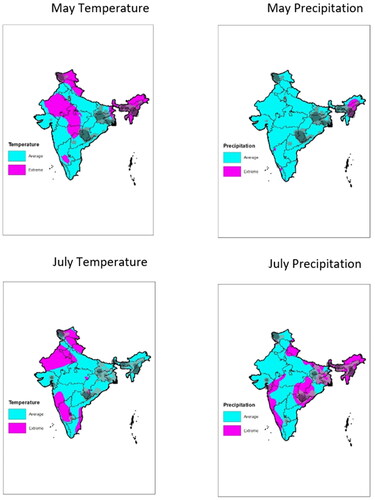
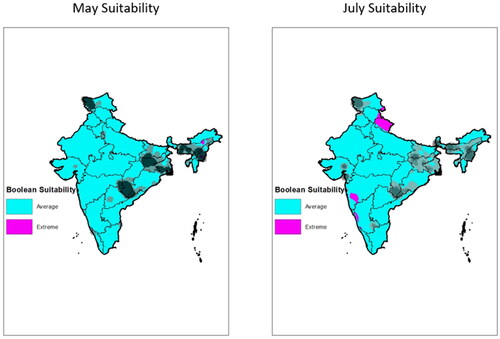
Figure 5. Boolean suitability rasters of combined climatological effects on terrorism in India.
Supplemental material

