
Figures & data
Figure 1. The territory of Guinea-Bissau and its main meteorological stations, with longer climatological series.
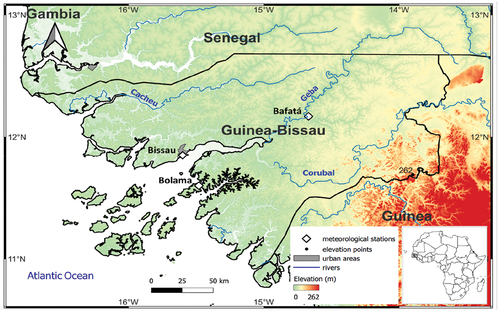
Figure 2. Mean monthly temperature (line) and mean monthly precipitation (columns) in Bissau/Observatory station, over the period 1981–2010. Data source: National Institute of Meteorology of Guinea-Bissau.
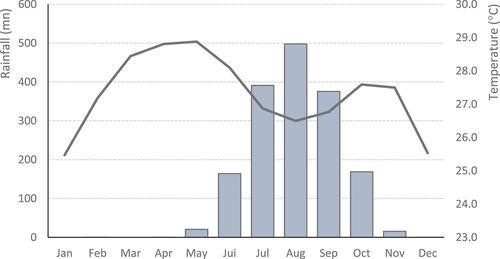
Table 1. Monthly and daily meteorological observations that were used in this study. Source: National Institute of Meteorology of Guinea-Bissau.
Table 2. Temperature indices used in this study.
Table 3. Precipitation indices used in this study.
Figure 3. Interannual precipitation variability (1960–2020). (a) Bissau/Observatory; (b) Bolama; (c) Bafatá.
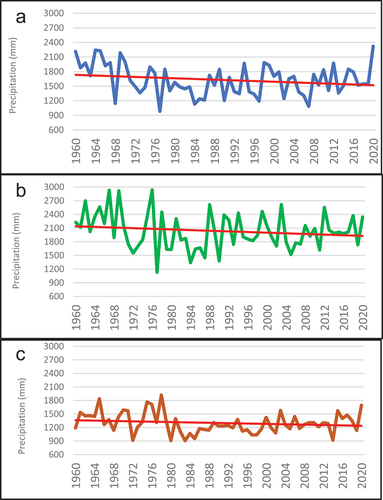
Table 4. Estimated trends (by decade) of total monthly precipitation, for the three studied stations, over the period 1960 to 2020.
Figure 4. Interannual variability of precipitation indices in Guinea-Bissau over the period 1981 to 2020. (A: Bissau/Observatory; B: Bolama; C: Bafatá; PRCPTOT: Annual sum of daily precipitation ≥ 1.0 mm; CDD: Maximum annual number of consecutive dry days (when precipitation < 1.0 mm); RX5DAY: Maximum annual 5−day precipitation total; SDII: Annual total precipitation divided by the number of wet days (when total precipitation ≥ 1.0 mm).
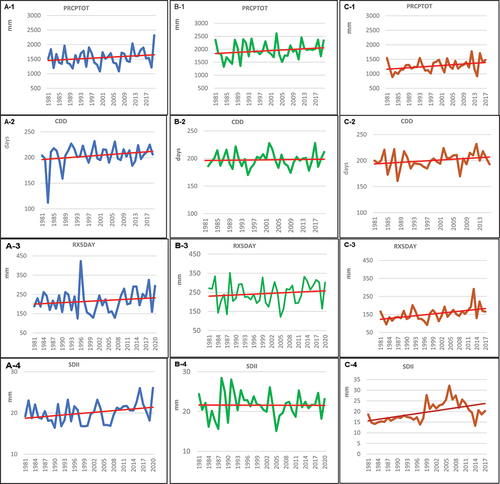
Table 5. Estimated trends (by decade) of precipitation indices, for the three studied stations, over the period 1981 to 2020.
Table 6. Summary of the trends of temperature indices for the period 1960–2020. TX: monthly average of maximum temperature; TN: monthly average of minimum temperature.
Figure 5. Interannual variability of temperature indices in Guinea-Bissau over the period 1981 to 2020. (A: Bissau/Observatory; B: Bolama; C: Bafatá; TXge30: Annual number of days when TX ≥ 30°C; TXge35: Annual number of days when TX ≥ 35 degrees_ºC; dtr: Mean annual difference between daily TX and daily TN.
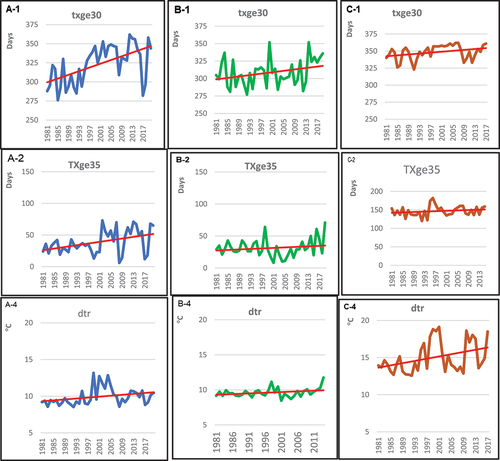
Table 7. Summary of the trends of daily temperature indices for the period 1981–2020.