

Figures & data
Table 1. Repartition of risks according to the process of isolation and conditioning
Table 2. Rating scale of occurrence, severity and detectability
Table 3. Matrix of level of criticality according to the risk mapping
Figure 1. Process mapping of human islet isolation and conditioning
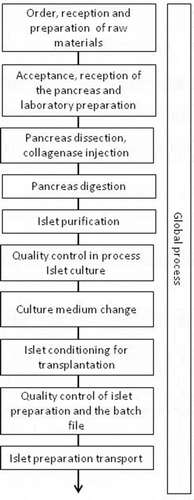
Table 4. Highest scoring failure mode of different steps in islet isolation process
Figure 2. Distribution of risk level of criticality. Distribution of risk level for the 230 identified risks during the raw evaluation analysis (a) and after new evaluation post FMEA (b) during which the means of control and quality assurance procedures implemented were taken into account
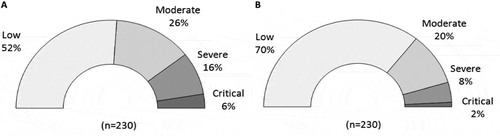
Table 5. Highest scoring failure mode of different steps in islet isolation process

