
Figures & data
Figure 1. Curve of void ratio versus log (time) and definition ‘secondary: compression coefficient (adapted from Yin and Feng, Citation2016).
Figure 2. Schematic diagram of incremental stress and strain ratios.
Figure 3. Stress conditions applied in creep test on a lightly overconsolidated clay (Le et al., Citation2019, modified from Tavenas et al. Citation1978).
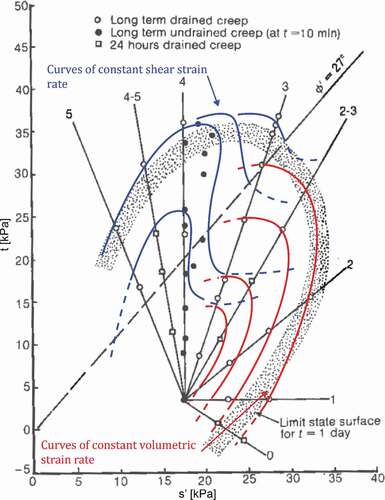
Figure 4. One-dimensional compression curves of structured and unstructured gypsum–kaolin specimens (Le and Airey Citation2021).
Table 1. Material properties.
Figure 5. One-dimensional compression curves of undisturbed and reconstituted specimens of London Clay.
Table 2. Test summary.
Figure 6. Effective stress paths for tests on gypsum-kaolin (GK) specimens.
Figure 7. Effective stress paths for tests on London Clay (LC) specimens.
Figure 8. Development of strain for gypsum-kaolin (GK) specimens (a) stress-strain behaviour. (b) time of strain development.
Figure 9. Large stress-strain behaviour of intact London Clay (LC) with intermediate stages of constant stress.
Figure 10. Development of volumetric and shear strain with time for samples of London Clay with time.
Figure 11. Development of strain increment for gypsum kaolin (GK) specimens.
Figure 12. Development of strain increments for LC specimens.
Figure 13. Ratios of incremental creep viscous strain components for GK specimens in stress space.
Figure 14. Ratios of incremental viscous creep strain components for LC specimens in stress space.
Figure 15. Typical strain development at constant stress. Development of strain for Sample LC1 at Creep Stage 3: Volumetric (a) strain against time (b) strain-rate against time; Shear (c) strain against time (d) strain-rate against time.
Figure 16. Influence of incremental stress ratio ( on the settlement time curves (after Leonards and Altschaeffl Citation1964) with permission from ASCE.
Table